.
.
Legal Acts
Documents
Electoral Bodies
Election Committees and Candidates
Turnout
Results
Statistical Data
SENATE
Created by
.
.
Voting Results
.
.
.
Voting Results for Committee
.
.
.
.
.
.
.
.
.
.
.
.
.
.
.
.
.
.
.
.
Polska
/
Gdańsk
/
nowodworski, pow.
...
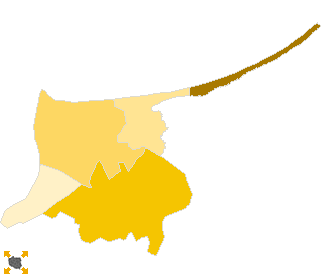
Komitet Wyborczy Platforma Obywatelska RP
List's Number:
8
No. of valid votes:
12633
No. of votes per List:
5622
44.50%
lack
37.72%
39.08%
40.44%
41.80%
43.16%
44.52%
45.88%
47.24%
48.60%
49.96%
not
of data
39.07%
40.43%
41.79%
43.15%
44.51%
45.87%
47.23%
48.59%
49.95%
51.32%
applicable
See also:
Turnout
Votes per Lists
Votes per Candidates
Information about Election Committee
Election results
Voting Results by location of ward electoral commission
.
.
Voting Results for Committee.
.
.
.
.
.
.
.
.
.
.
.
.
.
.
.
.
.
No.
Name
No. of entitled
to vote
No. of ballot papers
issued
No. of votes
No. of votes: per list / valid [%]
total
valid
per List
221001
Krynica Morska, m.
1183
677
677
663
340
51.28
221002
Nowy Dwór Gdański, gm.
14109
6409
6408
6271
2880
45.93
221003
Ostaszewo, gm.
2488
1111
1111
1079
407
37.72
221004
Stegna, gm.
7669
3403
3390
3272
1447
44.22
221005
Sztutowo, gm.
2835
1399
1397
1348
548
40.65
nowodworski, pow.
28284
12999
12983
12633
5622
44.50
.
.
Voting Results for Candidates
.
.
.
.
.
.
.
.
.
.
.
.
.
.
.
No.
Surname Names
No. of votes
% No. of votes per candidate/No. per list
% No. of votes per candidate/No. of valid votes
1
NOWAK Sławomir Ryszard
1495
26.59
11.83
2
ZIELIŃSKA-GŁĘBOCKA Anna Maria
346
6.15
2.74
3
RYBICKI Arkadiusz Czesław
224
3.98
1.77
4
KOZDROŃ Jerzy
403
7.16
3.19
5
OŁOWSKI Piotr Paweł
135
2.40
1.07
6
NEUMANN Sławomir Arkadiusz
125
2.22
0.99
7
CZAPLA Mirosław Jan
65
1.15
0.51
8
POMASKA Agnieszka Dominika
140
2.49
1.11
9
ORŁOWSKI Paweł
66
1.17
0.52
10
BOROWCZAK Jerzy Stanisław
111
1.97
0.88
11
ŚWILSKI Ryszard Jan
29
0.51
0.23
12
TARASZKIEWICZ-GURZYŃSKA Maria Barbara
43
0.76
0.34
13
PAWŁOWSKI Bogdan Józef
110
1.95
0.87
14
KULAS Jan Edward
70
1.24
0.55
15
GAŁKA Wiesław Jerzy
464
8.25
3.67
16
KALICKI Stanisław Aleksander
22
0.39
0.17
17
PRUŚ Sylwester Zbigniew
15
0.26
0.12
18
SZABANOWICZ Helena Halina
27
0.48
0.21
19
WORON Aleksandra Urszula
20
0.35
0.16
20
KASZUBSKI Adam
27
0.48
0.21
21
CZERNIEWSKI Paweł Marcin
21
0.37
0.17
22
ZIELIŃSKI Jan
35
0.62
0.28
23
GUZOWSKA Iwona Kamila
246
4.37
1.95
24
WAŁĘSA Jarosław Leszek
1383
24.59
10.95
Σ
5622
100.00
44.50
.
.
Voting Results by location of ward electoral commission.
.
.
.
.
.
.
.
.
.
.
.
.
.
.
.
.
.
No.
Name
No. of entitled
to vote
No. of ballot
papers issued
No. of votes
No. of votes: per list / valid [%]
total
valid
per List
1
City
10012
5078
5065
4962
2569
51.77
2
Country
18272
7921
7918
7671
3053
39.80
.
Voting Results by number of inhabitants of commune
.
1
to 5 000
6506
3187
3185
3090
1295
41.91
2
from 5 001 to 10 000
7669
3403
3390
3272
1447
44.22
3
from 10 001 to 20 000
14109
6409
6408
6271
2880
45.93
4
from 20 001 to 50 000
0
0
0
0
0
0.00
5
from 50 001 to 100 000
0
0
0
0
0
0.00
6
from 100 001 to 200 000
0
0
0
0
0
0.00
7
from 200 001 to 500 000
0
0
0
0
0
0.00
8
over 500 000
0
0
0
0
0
0.00
Legal Acts
Documents
Electoral Bodies
Election Committees and Candidates
Turnout
Results
Statistical Data
SENATE
Created by
Copyright © 2007
Mikrobit Sp. z o.o.
. All Rights Reserved.
top