.
.
Legal Acts
Documents
Electoral Bodies
Election Committees and Candidates
Turnout
Results
Statistical Data
SENATE
Created by
.
.
Voting Results
.
.
.
Voting Results for Committee
.
.
.
.
.
.
.
.
.
.
.
.
.
.
.
.
.
.
.
.
Polska
/
Gdańsk
/
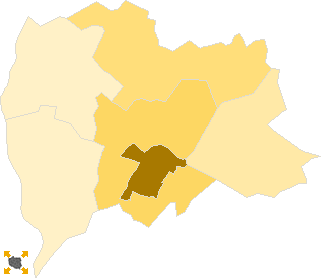
malborski, pow.
...
Komitet Wyborczy Platforma Obywatelska RP
List's Number:
8
No. of valid votes:
24842
No. of votes per List:
11270
45.37%
lack
27.37%
29.79%
32.21%
34.63%
37.05%
39.47%
41.89%
44.31%
46.73%
49.15%
not
of data
29.78%
32.20%
34.62%
37.04%
39.46%
41.88%
44.30%
46.72%
49.14%
51.57%
applicable
See also:
Turnout
Votes per Lists
Votes per Candidates
Information about Election Committee
Election results
Voting Results by location of ward electoral commission
.
.
Voting Results for Committee.
.
.
.
.
.
.
.
.
.
.
.
.
.
.
.
.
.
No.
Name
No. of entitled
to vote
No. of ballot papers
issued
No. of votes
No. of votes: per list / valid [%]
total
valid
per List
220903
Lichnowy, gm.
3495
1463
1462
1408
386
27.41
220904
Malbork, gm.
3182
1290
1289
1252
469
37.46
220901
Malbork, m.
31345
17186
17169
16904
8714
51.55
220906
Miłoradz, gm.
2663
1073
1071
1041
285
27.38
220907
Nowy Staw, gm.
6135
2691
2688
2590
905
34.94
220908
Stare Pole, gm.
3593
1679
1678
1647
511
31.03
malborski, pow.
50413
25382
25357
24842
11270
45.37
.
.
Voting Results for Candidates
.
.
.
.
.
.
.
.
.
.
.
.
.
.
.
No.
Surname Names
No. of votes
% No. of votes per candidate/No. per list
% No. of votes per candidate/No. of valid votes
1
NOWAK Sławomir Ryszard
2922
25.92
11.76
2
ZIELIŃSKA-GŁĘBOCKA Anna Maria
550
4.88
2.21
3
RYBICKI Arkadiusz Czesław
278
2.46
1.12
4
KOZDROŃ Jerzy
259
2.29
1.04
5
OŁOWSKI Piotr Paweł
140
1.24
0.56
6
NEUMANN Sławomir Arkadiusz
123
1.09
0.50
7
CZAPLA Mirosław Jan
3405
30.21
13.71
8
POMASKA Agnieszka Dominika
161
1.42
0.65
9
ORŁOWSKI Paweł
110
0.97
0.44
10
BOROWCZAK Jerzy Stanisław
127
1.12
0.51
11
ŚWILSKI Ryszard Jan
35
0.31
0.14
12
TARASZKIEWICZ-GURZYŃSKA Maria Barbara
75
0.66
0.30
13
PAWŁOWSKI Bogdan Józef
83
0.73
0.33
14
KULAS Jan Edward
136
1.20
0.55
15
GAŁKA Wiesław Jerzy
88
0.78
0.35
16
KALICKI Stanisław Aleksander
37
0.32
0.15
17
PRUŚ Sylwester Zbigniew
26
0.23
0.10
18
SZABANOWICZ Helena Halina
45
0.39
0.18
19
WORON Aleksandra Urszula
394
3.49
1.59
20
KASZUBSKI Adam
56
0.49
0.23
21
CZERNIEWSKI Paweł Marcin
40
0.35
0.16
22
ZIELIŃSKI Jan
45
0.39
0.18
23
GUZOWSKA Iwona Kamila
420
3.72
1.69
24
WAŁĘSA Jarosław Leszek
1715
15.21
6.90
Σ
11270
100.00
45.36
.
.
Voting Results by location of ward electoral commission.
.
.
.
.
.
.
.
.
.
.
.
.
.
.
.
.
.
No.
Name
No. of entitled
to vote
No. of ballot
papers issued
No. of votes
No. of votes: per list / valid [%]
total
valid
per List
1
City
36422
19517
19497
19154
9523
49.72
2
Country
13991
5865
5860
5688
1747
30.71
.
Voting Results by number of inhabitants of commune
.
1
to 5 000
12933
5505
5500
5348
1651
30.87
2
from 5 001 to 10 000
6135
2691
2688
2590
905
34.94
3
from 10 001 to 20 000
0
0
0
0
0
0.00
4
from 20 001 to 50 000
31345
17186
17169
16904
8714
51.55
5
from 50 001 to 100 000
0
0
0
0
0
0.00
6
from 100 001 to 200 000
0
0
0
0
0
0.00
7
from 200 001 to 500 000
0
0
0
0
0
0.00
8
over 500 000
0
0
0
0
0
0.00
Legal Acts
Documents
Electoral Bodies
Election Committees and Candidates
Turnout
Results
Statistical Data
SENATE
Created by
Copyright © 2007
Mikrobit Sp. z o.o.
. All Rights Reserved.
top