.
.
Legal Acts
Documents
Electoral Bodies
Election Committees and Candidates
Turnout
Results
Statistical Data
SENATE
Created by
.
.
Voting Results
.
.
.
Voting Results for Committee
.
.
.
.
.
.
.
.
.
.
.
.
.
.
.
.
.
.
.
.
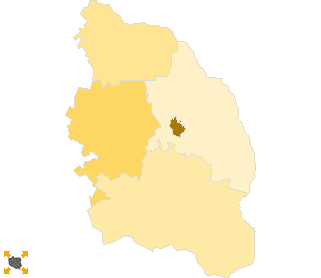
Polska
/
Białystok
/
sejneński, pow.
...
Komitet Wyborczy Platforma Obywatelska RP
List's Number:
8
No. of valid votes:
6470
No. of votes per List:
1807
27.93%
lack
21.00%
22.56%
24.12%
25.68%
27.24%
28.80%
30.36%
31.92%
33.48%
35.04%
not
of data
22.55%
24.11%
25.67%
27.23%
28.79%
30.35%
31.91%
33.47%
35.03%
36.60%
applicable
See also:
Turnout
Votes per Lists
Votes per Candidates
Information about Election Committee
Election results
Voting Results by location of ward electoral commission
.
.
Voting Results for Committee.
.
.
.
.
.
.
.
.
.
.
.
.
.
.
.
.
.
No.
Name
No. of entitled
to vote
No. of ballot papers
issued
No. of votes
No. of votes: per list / valid [%]
total
valid
per List
200902
Giby, gm.
2394
1029
1029
1011
230
22.75
200903
Krasnopol, gm.
3117
1077
1077
1034
282
27.27
200904
Puńsk, gm.
3539
1286
1286
1244
304
24.44
200905
Sejny, gm.
3333
1120
1120
1100
231
21.00
200901
Sejny, m.
4661
2134
2134
2081
760
36.52
sejneński, pow.
17044
6646
6646
6470
1807
27.93
.
.
Voting Results for Candidates
.
.
.
.
.
.
.
.
.
.
.
.
.
.
.
No.
Surname Names
No. of votes
% No. of votes per candidate/No. per list
% No. of votes per candidate/No. of valid votes
1
TYSZKIEWICZ Robert
352
19.47
5.44
2
CIEŚLIK Leszek Stanisław
246
13.61
3.80
3
LECH Mirosław
29
1.60
0.45
4
GŁAZ Maciej
15
0.83
0.23
5
KLIM Józef Piotr
73
4.03
1.13
6
SNARSKI Sławomir Jerzy
10
0.55
0.15
7
CIEŚLUKOWSKI Cezary
690
38.18
10.66
8
MASALSKI Marek
25
1.38
0.39
9
TUROSIEŃSKA Katarzyna Monika
31
1.71
0.48
10
SAPIŃSKA Daria Krystyna
12
0.66
0.19
11
MARCZUK Stanisław Marian
8
0.44
0.12
12
WOŹNIEWSKA Anna
18
0.99
0.28
13
ARŁUKOWICZ Tadeusz
5
0.27
0.08
14
CHOJNOWSKI Marek Jerzy
8
0.44
0.12
15
ŻALEK Jacek
28
1.54
0.43
16
MANTUR Mikołaj
3
0.16
0.05
17
WISZOWATY Stanisław
7
0.38
0.11
18
STUDNIAREK Arkadiusz
1
0.05
0.02
19
GOŁASZEWSKA Alicja Agata
27
1.49
0.42
20
PRUSZKOWSKI Janusz
6
0.33
0.09
21
JABŁOŃSKI Zdzisław
28
1.54
0.43
22
CHAŃKO Jacek Krzysztof
12
0.66
0.19
23
BAZIUTA Grażyna
8
0.44
0.12
24
DYMEK Andrzej
12
0.66
0.19
25
GRAJEK Zbysław Wojciech
67
3.70
1.04
26
STALEWSKI Wiesław Antoni
1
0.05
0.02
27
NIKITOROWICZ Zbigniew
24
1.32
0.37
28
PIETRUCZUK Izabela
9
0.49
0.14
29
GRĄDZKI Jarosław
9
0.49
0.14
30
RACZKOWSKI Damian
43
2.37
0.66
Σ
1807
100.00
27.92
.
.
Voting Results by location of ward electoral commission.
.
.
.
.
.
.
.
.
.
.
.
.
.
.
.
.
.
No.
Name
No. of entitled
to vote
No. of ballot
papers issued
No. of votes
No. of votes: per list / valid [%]
total
valid
per List
1
City
4661
2134
2134
2081
760
36.52
2
Country
12383
4512
4512
4389
1047
23.86
.
Voting Results by number of inhabitants of commune
.
1
to 5 000
12383
4512
4512
4389
1047
23.86
2
from 5 001 to 10 000
4661
2134
2134
2081
760
36.52
3
from 10 001 to 20 000
0
0
0
0
0
0.00
4
from 20 001 to 50 000
0
0
0
0
0
0.00
5
from 50 001 to 100 000
0
0
0
0
0
0.00
6
from 100 001 to 200 000
0
0
0
0
0
0.00
7
from 200 001 to 500 000
0
0
0
0
0
0.00
8
over 500 000
0
0
0
0
0
0.00
Legal Acts
Documents
Electoral Bodies
Election Committees and Candidates
Turnout
Results
Statistical Data
SENATE
Created by
Copyright © 2007
Mikrobit Sp. z o.o.
. All Rights Reserved.
top