.
.
Legal Acts
Documents
Electoral Bodies
Election Committees and Candidates
Turnout
Results
Statistical Data
SENATE
Created by
.
.
Voting Results
.
.
.
Voting Results for Committee
.
.
.
.
.
.
.
.
.
.
.
.
.
.
.
.
.
.
.
.
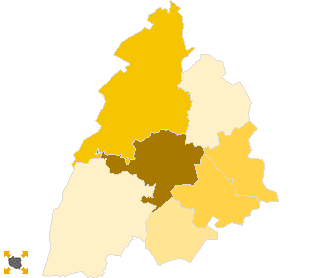
Polska
/
Białystok
/
moniecki, pow.
...
Komitet Wyborczy Platforma Obywatelska RP
List's Number:
8
No. of valid votes:
13369
No. of votes per List:
3130
23.41%
lack
9.00%
11.44%
13.88%
16.32%
18.76%
21.20%
23.64%
26.08%
28.52%
30.96%
not
of data
11.43%
13.87%
16.31%
18.75%
21.19%
23.63%
26.07%
28.51%
30.95%
33.40%
applicable
See also:
Turnout
Votes per Lists
Votes per Candidates
Information about Election Committee
Election results
Voting Results by location of ward electoral commission
.
.
Voting Results for Committee.
.
.
.
.
.
.
.
.
.
.
.
.
.
.
.
.
.
No.
Name
No. of entitled
to vote
No. of ballot papers
issued
No. of votes
No. of votes: per list / valid [%]
total
valid
per List
200801
Goniądz, gm.
4130
1685
1683
1628
392
24.08
200802
Jasionówka, gm.
2455
999
999
976
210
21.52
200803
Jaświły, gm.
4458
1677
1677
1626
181
11.13
200804
Knyszyn, gm.
3945
1633
1633
1556
351
22.56
200805
Krypno, gm.
3231
1309
1309
1282
199
15.52
200806
Mońki, gm.
12656
5209
5208
5057
1685
33.32
200807
Trzcianne, gm.
3821
1305
1305
1244
112
9.00
moniecki, pow.
34696
13817
13814
13369
3130
23.41
.
.
Voting Results for Candidates
.
.
.
.
.
.
.
.
.
.
.
.
.
.
.
No.
Surname Names
No. of votes
% No. of votes per candidate/No. per list
% No. of votes per candidate/No. of valid votes
1
TYSZKIEWICZ Robert
552
17.63
4.13
2
CIEŚLIK Leszek Stanisław
42
1.34
0.31
3
LECH Mirosław
342
10.92
2.56
4
GŁAZ Maciej
15
0.47
0.11
5
KLIM Józef Piotr
556
17.76
4.16
6
SNARSKI Sławomir Jerzy
29
0.92
0.22
7
CIEŚLUKOWSKI Cezary
14
0.44
0.10
8
MASALSKI Marek
16
0.51
0.12
9
TUROSIEŃSKA Katarzyna Monika
32
1.02
0.24
10
SAPIŃSKA Daria Krystyna
24
0.76
0.18
11
MARCZUK Stanisław Marian
14
0.44
0.10
12
WOŹNIEWSKA Anna
37
1.18
0.28
13
ARŁUKOWICZ Tadeusz
13
0.41
0.10
14
CHOJNOWSKI Marek Jerzy
44
1.40
0.33
15
ŻALEK Jacek
119
3.80
0.89
16
MANTUR Mikołaj
9
0.28
0.07
17
WISZOWATY Stanisław
28
0.89
0.21
18
STUDNIAREK Arkadiusz
763
24.37
5.71
19
GOŁASZEWSKA Alicja Agata
20
0.63
0.15
20
PRUSZKOWSKI Janusz
6
0.19
0.04
21
JABŁOŃSKI Zdzisław
50
1.59
0.37
22
CHAŃKO Jacek Krzysztof
76
2.42
0.57
23
BAZIUTA Grażyna
11
0.35
0.08
24
DYMEK Andrzej
14
0.44
0.10
25
GRAJEK Zbysław Wojciech
8
0.25
0.06
26
STALEWSKI Wiesław Antoni
3
0.09
0.02
27
NIKITOROWICZ Zbigniew
15
0.47
0.11
28
PIETRUCZUK Izabela
12
0.38
0.09
29
GRĄDZKI Jarosław
50
1.59
0.37
30
RACZKOWSKI Damian
216
6.90
1.62
Σ
3130
100.00
23.41
.
.
Voting Results by location of ward electoral commission.
.
.
.
.
.
.
.
.
.
.
.
.
.
.
.
.
.
No.
Name
No. of entitled
to vote
No. of ballot
papers issued
No. of votes
No. of votes: per list / valid [%]
total
valid
per List
1
City
15827
6754
6751
6531
2239
34.28
2
Country
18869
7063
7063
6838
891
13.03
.
Voting Results by number of inhabitants of commune
.
1
to 5 000
9507
3613
3613
3502
521
14.88
2
from 5 001 to 10 000
12533
4995
4993
4810
924
19.21
3
from 10 001 to 20 000
12656
5209
5208
5057
1685
33.32
4
from 20 001 to 50 000
0
0
0
0
0
0.00
5
from 50 001 to 100 000
0
0
0
0
0
0.00
6
from 100 001 to 200 000
0
0
0
0
0
0.00
7
from 200 001 to 500 000
0
0
0
0
0
0.00
8
over 500 000
0
0
0
0
0
0.00
Legal Acts
Documents
Electoral Bodies
Election Committees and Candidates
Turnout
Results
Statistical Data
SENATE
Created by
Copyright © 2007
Mikrobit Sp. z o.o.
. All Rights Reserved.
top