.
.
Legal Acts
Documents
Electoral Bodies
Election Committees and Candidates
Turnout
Results
Statistical Data
SENATE
Created by
.
.
Voting Results
.
.
.
Voting Results for Committee
.
.
.
.
.
.
.
.
.
.
.
.
.
.
.
.
.
.
.
.
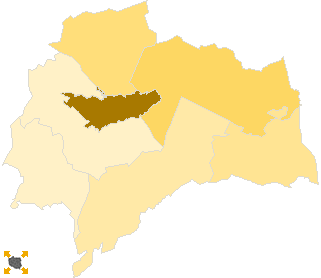
Polska
/
Białystok
/
augustowski, pow.
...
Komitet Wyborczy Platforma Obywatelska RP
List's Number:
8
No. of valid votes:
20928
No. of votes per List:
7907
37.78%
lack
17.14%
20.29%
23.44%
26.59%
29.74%
32.89%
36.04%
39.19%
42.34%
45.49%
not
of data
20.28%
23.43%
26.58%
29.73%
32.88%
36.03%
39.18%
42.33%
45.48%
48.64%
applicable
See also:
Turnout
Votes per Lists
Votes per Candidates
Information about Election Committee
Election results
Voting Results by location of ward electoral commission
.
.
Voting Results for Committee.
.
.
.
.
.
.
.
.
.
.
.
.
.
.
.
.
.
No.
Name
No. of entitled
to vote
No. of ballot papers
issued
No. of votes
No. of votes: per list / valid [%]
total
valid
per List
200102
Augustów, gm.
5239
2057
2057
2011
382
19.00
200101
Augustów, m.
23881
12388
12384
12216
5932
48.56
200103
Bargłów Kościelny, gm.
4564
1586
1585
1563
268
17.15
200104
Lipsk, gm.
4645
1612
1612
1576
392
24.87
200105
Nowinka, gm.
2296
1060
1060
1028
296
28.79
200106
Płaska, gm.
2098
903
899
877
277
31.58
200107
Sztabin, gm.
4366
1689
1689
1657
360
21.73
augustowski, pow.
47089
21295
21286
20928
7907
37.78
.
.
Voting Results for Candidates
.
.
.
.
.
.
.
.
.
.
.
.
.
.
.
No.
Surname Names
No. of votes
% No. of votes per candidate/No. per list
% No. of votes per candidate/No. of valid votes
1
TYSZKIEWICZ Robert
392
4.95
1.87
2
CIEŚLIK Leszek Stanisław
6352
80.33
30.35
3
LECH Mirosław
81
1.02
0.39
4
GŁAZ Maciej
15
0.18
0.07
5
KLIM Józef Piotr
40
0.50
0.19
6
SNARSKI Sławomir Jerzy
23
0.29
0.11
7
CIEŚLUKOWSKI Cezary
354
4.47
1.69
8
MASALSKI Marek
18
0.22
0.09
9
TUROSIEŃSKA Katarzyna Monika
42
0.53
0.20
10
SAPIŃSKA Daria Krystyna
23
0.29
0.11
11
MARCZUK Stanisław Marian
15
0.18
0.07
12
WOŹNIEWSKA Anna
19
0.24
0.09
13
ARŁUKOWICZ Tadeusz
12
0.15
0.06
14
CHOJNOWSKI Marek Jerzy
23
0.29
0.11
15
ŻALEK Jacek
90
1.13
0.43
16
MANTUR Mikołaj
4
0.05
0.02
17
WISZOWATY Stanisław
17
0.21
0.08
18
STUDNIAREK Arkadiusz
3
0.03
0.01
19
GOŁASZEWSKA Alicja Agata
32
0.40
0.15
20
PRUSZKOWSKI Janusz
3
0.03
0.01
21
JABŁOŃSKI Zdzisław
20
0.25
0.10
22
CHAŃKO Jacek Krzysztof
27
0.34
0.13
23
BAZIUTA Grażyna
14
0.17
0.07
24
DYMEK Andrzej
13
0.16
0.06
25
GRAJEK Zbysław Wojciech
19
0.24
0.09
26
STALEWSKI Wiesław Antoni
4
0.05
0.02
27
NIKITOROWICZ Zbigniew
9
0.11
0.04
28
PIETRUCZUK Izabela
33
0.41
0.16
29
GRĄDZKI Jarosław
26
0.32
0.12
30
RACZKOWSKI Damian
184
2.32
0.88
Σ
7907
100.00
37.78
.
.
Voting Results by location of ward electoral commission.
.
.
.
.
.
.
.
.
.
.
.
.
.
.
.
.
.
No.
Name
No. of entitled
to vote
No. of ballot
papers issued
No. of votes
No. of votes: per list / valid [%]
total
valid
per List
1
City
25954
13238
13234
13051
6200
47.51
2
Country
21135
8057
8052
7877
1707
21.67
.
Voting Results by number of inhabitants of commune
.
1
to 5 000
4394
1963
1959
1905
573
30.08
2
from 5 001 to 10 000
18814
6944
6943
6807
1402
20.60
3
from 10 001 to 20 000
0
0
0
0
0
0.00
4
from 20 001 to 50 000
23881
12388
12384
12216
5932
48.56
5
from 50 001 to 100 000
0
0
0
0
0
0.00
6
from 100 001 to 200 000
0
0
0
0
0
0.00
7
from 200 001 to 500 000
0
0
0
0
0
0.00
8
over 500 000
0
0
0
0
0
0.00
Legal Acts
Documents
Electoral Bodies
Election Committees and Candidates
Turnout
Results
Statistical Data
SENATE
Created by
Copyright © 2007
Mikrobit Sp. z o.o.
. All Rights Reserved.
top