.
.
 
. .
Voting Results
.
. . Voting Results for Committee . .
. .
. . . . . . . . . . . . . . . .
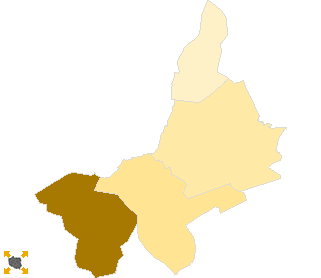
Polska / Rzeszów / tarnobrzeski, pow. ...
Komitet Wyborczy Platforma Obywatelska RP
List's Number: 8
No. of valid votes: 19899
No. of votes per List: 6585
33.09%
lack27.74%29.21%30.68%32.15%33.62%35.09%36.56%38.03%39.50%40.97%not
of data29.20%30.67%32.14%33.61%35.08%36.55%38.02%39.49%40.96%42.44%applicable

See also:
. . Voting Results for Committee. . .
. .
. . . . . . . . . . . . .
No. Name No. of entitled
to vote
No. of ballot papers
issued
No. of votes No. of votes: per list / valid [%]
total valid per List
182001Baranów Sandomierski, gm.9486497149684779202842.44
182002Gorzyce, gm.10829496749674808133427.75
182003Grębów, gm.749831643164307091529.80
182004Nowa Dęba, gm.15564741274117242230831.87
  tarnobrzeski, pow. 43377 20514 20510 19899 6585 33.09

. . Voting Results for Candidates . .
. .
. . . . . . . . . . .
No. Surname Names No. of votes % No. of votes per candidate/No. per list % No. of votes per candidate/No. of valid votes
1RYNASIEWICZ Zbigniew Franciszek4326.562.17
2SKOWROŃSKA Krystyna2854.321.43
3TOMAKA Jan Walenty400.600.20
4KUBAS-HUL Teresa Krystyna480.720.24
5PLUTA Mirosław Stanisław343152.1017.24
6KOŚCIELNY Stanisław4066.162.04
7BUTRYN Renata Celina1422.150.71
8KOSIOROWSKI Franciszek420.630.21
9CYNKAR Sławomir Tadeusz120.180.06
10KASPEREK Romualda300.450.15
11KAPAŁA Ryszard70410.693.54
12MORYCZ Wincenty100.150.05
13CYRAN Tomasz Władysław150.220.08
14MIERZWA Artur270.410.14
15OŻÓG Krzysztof230.340.12
16CIEŚLA Marcin Daniel150.220.08
17WSZOŁEK Jacek Karol70.100.04
18ŻMUDA Dariusz250.370.13
19KRAWIEC Stanisław Jan3264.951.64
20STĘPIEŃ Danuta Waleria560.850.28
21RĄCZY Małgorzata190.280.10
22MAŃKA Jan Stanisław70.100.04
23BUKOWSKI Dariusz3124.731.57
24GRZYWACZ Zygmunt80.120.04
25CHMURA Andrzej270.410.14
26MĄCZKA Maria380.570.19
27KALANDYK Zbigniew Franciszek130.190.07
28GAWRYŚ Andrzej180.270.09
29MRYCZKO Piotr Paweł120.180.06
30KARKUT Michał550.830.28
Σ   6585 100.00 33.09
 
. . Voting Results by location of ward electoral commission. . .
. .
. . . . . . . . . . . . .
No. Name No. of entitled
to vote
No. of ballot
papers issued
No. of votes No. of votes: per list / valid [%]
total valid per List
1City10912542654255327205238.52
2Country32465150881508514572453331.11
. Voting Results by number of inhabitants of commune .
1to 5 000000000.00 
2from 5 001 to 10 000749831643164307091529.80
3from 10 001 to 20 00035879173501734616829567033.69
4from 20 001 to 50 000000000.00 
5from 50 001 to 100 000000000.00 
6from 100 001 to 200 000000000.00 
7from 200 001 to 500 000000000.00 
8over 500 000000000.00 

  Legal Acts Documents Electoral Bodies Election Committees and Candidates Turnout Results Statistical Data SENATE Created by
 top