.
.
 
. .
Voting Results
.
. . Voting Results for Committee . .
. .
. . . . . . . . . . . . . . . .
Polska / Rzeszów / strzyżowski, pow. ...
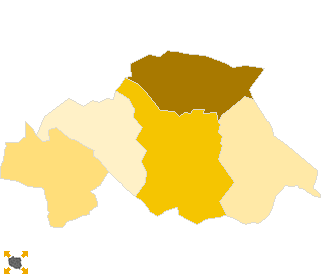
Komitet Wyborczy Platforma Obywatelska RP
List's Number: 8
No. of valid votes: 22003
No. of votes per List: 4560
20.72%
lack14.64%15.83%17.02%18.21%19.40%20.59%21.78%22.97%24.16%25.35%not
of data15.82%17.01%18.20%19.39%20.58%21.77%22.96%24.15%25.34%26.54%applicable

See also:
. . Voting Results for Committee. . .
. .
. . . . . . . . . . . . .
No. Name No. of entitled
to vote
No. of ballot papers
issued
No. of votes No. of votes: per list / valid [%]
total valid per List
181901Czudec, gm.8992470146994595121926.53
181902Frysztak, gm.806835453543343464318.72
181903Niebylec, gm.818039363936384063816.61
181904Strzyżów, gm.16501753575347313164722.52
181905Wiśniowa, gm.652528792865282141314.64
  strzyżowski, pow. 48266 22596 22577 22003 4560 20.72

. . Voting Results for Candidates . .
. .
. . . . . . . . . . .
No. Surname Names No. of votes % No. of votes per candidate/No. per list % No. of votes per candidate/No. of valid votes
1RYNASIEWICZ Zbigniew Franciszek103222.634.69
2SKOWROŃSKA Krystyna63513.922.89
3TOMAKA Jan Walenty2545.571.15
4KUBAS-HUL Teresa Krystyna1042.280.47
5PLUTA Mirosław Stanisław571.250.26
6KOŚCIELNY Stanisław561.220.25
7BUTRYN Renata Celina450.980.20
8KOSIOROWSKI Franciszek481.050.22
9CYNKAR Sławomir Tadeusz144831.756.58
10KASPEREK Romualda260.570.12
11KAPAŁA Ryszard1012.210.46
12MORYCZ Wincenty150.320.07
13CYRAN Tomasz Władysław1342.930.61
14MIERZWA Artur220.480.10
15OŻÓG Krzysztof2124.640.96
16CIEŚLA Marcin Daniel320.700.15
17WSZOŁEK Jacek Karol410.890.19
18ŻMUDA Dariusz250.540.11
19KRAWIEC Stanisław Jan130.280.06
20STĘPIEŃ Danuta Waleria681.490.31
21RĄCZY Małgorzata340.740.15
22MAŃKA Jan Stanisław80.170.04
23BUKOWSKI Dariusz160.350.07
24GRZYWACZ Zygmunt90.190.04
25CHMURA Andrzej360.780.16
26MĄCZKA Maria230.500.10
27KALANDYK Zbigniew Franciszek160.350.07
28GAWRYŚ Andrzej110.240.05
29MRYCZKO Piotr Paweł70.150.03
30KARKUT Michał320.700.15
Σ   4560 100.00 20.72
 
. . Voting Results by location of ward electoral commission. . .
. .
. . . . . . . . . . . . .
No. Name No. of entitled
to vote
No. of ballot
papers issued
No. of votes No. of votes: per list / valid [%]
total valid per List
1City7063353635363451102129.59
2Country41203190601904118552353919.08
. Voting Results by number of inhabitants of commune .
1to 5 000000000.00 
2from 5 001 to 10 000652528792865282141314.64
3from 10 001 to 20 00025240121821217811869250021.06
4from 20 001 to 50 00016501753575347313164722.52
5from 50 001 to 100 000000000.00 
6from 100 001 to 200 000000000.00 
7from 200 001 to 500 000000000.00 
8over 500 000000000.00 

  Legal Acts Documents Electoral Bodies Election Committees and Candidates Turnout Results Statistical Data SENATE Created by
 top