.
.
Legal Acts
Documents
Electoral Bodies
Election Committees and Candidates
Turnout
Results
Statistical Data
SENATE
Created by
.
.
Voting Results
.
.
.
Voting Results for Committee
.
.
.
.
.
.
.
.
.
.
.
.
.
.
.
.
.
.
.
.
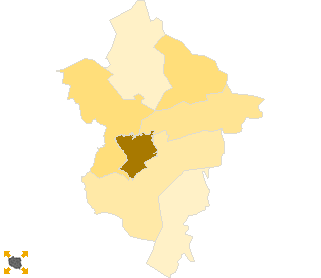
Polska
/
Rzeszów
/
łańcucki, pow.
...
Komitet Wyborczy Platforma Obywatelska RP
List's Number:
8
No. of valid votes:
32104
No. of votes per List:
7265
22.63%
lack
13.99%
16.03%
18.07%
20.11%
22.15%
24.19%
26.23%
28.27%
30.31%
32.35%
not
of data
16.02%
18.06%
20.10%
22.14%
24.18%
26.22%
28.26%
30.30%
32.34%
34.39%
applicable
See also:
Turnout
Votes per Lists
Votes per Candidates
Information about Election Committee
Election results
Voting Results by location of ward electoral commission
.
.
Voting Results for Committee.
.
.
.
.
.
.
.
.
.
.
.
.
.
.
.
.
.
No.
Name
No. of entitled
to vote
No. of ballot papers
issued
No. of votes
No. of votes: per list / valid [%]
total
valid
per List
181002
Białobrzegi, gm.
6183
2947
2934
2889
558
19.31
181003
Czarna, gm.
8303
4694
4694
4580
1007
21.99
181004
Łańcut, gm.
15667
8635
8625
8435
1464
17.36
181001
Łańcut, m.
14415
8610
8608
8487
2916
34.36
181005
Markowa, gm.
5050
2349
2348
2294
321
13.99
181006
Rakszawa, gm.
5438
2879
2879
2815
438
15.56
181007
Żołynia, gm.
5184
2669
2663
2604
561
21.54
łańcucki, pow.
60240
32783
32751
32104
7265
22.63
.
.
Voting Results for Candidates
.
.
.
.
.
.
.
.
.
.
.
.
.
.
.
No.
Surname Names
No. of votes
% No. of votes per candidate/No. per list
% No. of votes per candidate/No. of valid votes
1
RYNASIEWICZ Zbigniew Franciszek
3228
44.43
10.05
2
SKOWROŃSKA Krystyna
1032
14.20
3.21
3
TOMAKA Jan Walenty
508
6.99
1.58
4
KUBAS-HUL Teresa Krystyna
230
3.16
0.72
5
PLUTA Mirosław Stanisław
90
1.23
0.28
6
KOŚCIELNY Stanisław
61
0.83
0.19
7
BUTRYN Renata Celina
64
0.88
0.20
8
KOSIOROWSKI Franciszek
108
1.48
0.34
9
CYNKAR Sławomir Tadeusz
34
0.46
0.11
10
KASPEREK Romualda
24
0.33
0.07
11
KAPAŁA Ryszard
40
0.55
0.12
12
MORYCZ Wincenty
1020
14.03
3.18
13
CYRAN Tomasz Władysław
78
1.07
0.24
14
MIERZWA Artur
32
0.44
0.10
15
OŻÓG Krzysztof
154
2.11
0.48
16
CIEŚLA Marcin Daniel
25
0.34
0.08
17
WSZOŁEK Jacek Karol
20
0.27
0.06
18
ŻMUDA Dariusz
27
0.37
0.08
19
KRAWIEC Stanisław Jan
17
0.23
0.05
20
STĘPIEŃ Danuta Waleria
89
1.22
0.28
21
RĄCZY Małgorzata
46
0.63
0.14
22
MAŃKA Jan Stanisław
144
1.98
0.45
23
BUKOWSKI Dariusz
20
0.27
0.06
24
GRZYWACZ Zygmunt
10
0.13
0.03
25
CHMURA Andrzej
32
0.44
0.10
26
MĄCZKA Maria
36
0.49
0.11
27
KALANDYK Zbigniew Franciszek
14
0.19
0.04
28
GAWRYŚ Andrzej
12
0.16
0.04
29
MRYCZKO Piotr Paweł
5
0.06
0.02
30
KARKUT Michał
65
0.89
0.20
Σ
7265
100.00
22.62
.
.
Voting Results by location of ward electoral commission.
.
.
.
.
.
.
.
.
.
.
.
.
.
.
.
.
.
No.
Name
No. of entitled
to vote
No. of ballot
papers issued
No. of votes
No. of votes: per list / valid [%]
total
valid
per List
1
City
14415
8610
8608
8487
2916
34.36
2
Country
45825
24173
24143
23617
4349
18.41
.
Voting Results by number of inhabitants of commune
.
1
to 5 000
0
0
0
0
0
0.00
2
from 5 001 to 10 000
21855
10844
10824
10602
1878
17.71
3
from 10 001 to 20 000
22718
13304
13302
13067
3923
30.02
4
from 20 001 to 50 000
15667
8635
8625
8435
1464
17.36
5
from 50 001 to 100 000
0
0
0
0
0
0.00
6
from 100 001 to 200 000
0
0
0
0
0
0.00
7
from 200 001 to 500 000
0
0
0
0
0
0.00
8
over 500 000
0
0
0
0
0
0.00
Legal Acts
Documents
Electoral Bodies
Election Committees and Candidates
Turnout
Results
Statistical Data
SENATE
Created by
Copyright © 2007
Mikrobit Sp. z o.o.
. All Rights Reserved.
top