.
.
Legal Acts
Documents
Electoral Bodies
Election Committees and Candidates
Turnout
Results
Statistical Data
SENATE
Created by
.
.
Voting Results
.
.
.
Voting Results for Committee
.
.
.
.
.
.
.
.
.
.
.
.
.
.
.
.
.
.
.
.
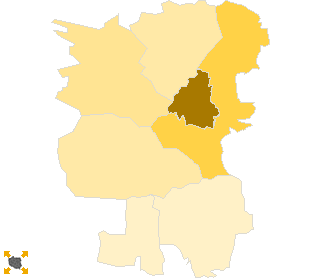
Polska
/
Rzeszów
/
dębicki, pow.
...
Komitet Wyborczy Platforma Obywatelska RP
List's Number:
8
No. of valid votes:
52320
No. of votes per List:
12913
24.68%
lack
11.87%
14.16%
16.45%
18.74%
21.03%
23.32%
25.61%
27.90%
30.19%
32.48%
not
of data
14.15%
16.44%
18.73%
21.02%
23.31%
25.60%
27.89%
30.18%
32.47%
34.77%
applicable
See also:
Turnout
Votes per Lists
Votes per Candidates
Information about Election Committee
Election results
Voting Results by location of ward electoral commission
.
.
Voting Results for Committee.
.
.
.
.
.
.
.
.
.
.
.
.
.
.
.
.
.
No.
Name
No. of entitled
to vote
No. of ballot papers
issued
No. of votes
No. of votes: per list / valid [%]
total
valid
per List
180302
Brzostek, gm.
9895
4391
4390
4236
503
11.87
180303
Czarna, gm.
9566
4769
4769
4638
795
17.14
180304
Dębica, gm.
18327
9069
9068
8869
2139
24.12
180301
Dębica, m.
38478
22087
22067
21676
7518
34.68
180305
Jodłowa, gm.
4262
1581
1581
1516
198
13.06
180306
Pilzno, gm.
13210
6577
6576
6431
1020
15.86
180307
Żyraków, gm.
10197
5116
5097
4954
740
14.94
dębicki, pow.
103935
53590
53548
52320
12913
24.68
.
.
Voting Results for Candidates
.
.
.
.
.
.
.
.
.
.
.
.
.
.
.
No.
Surname Names
No. of votes
% No. of votes per candidate/No. per list
% No. of votes per candidate/No. of valid votes
1
RYNASIEWICZ Zbigniew Franciszek
1956
15.14
3.74
2
SKOWROŃSKA Krystyna
1545
11.96
2.95
3
TOMAKA Jan Walenty
258
1.99
0.49
4
KUBAS-HUL Teresa Krystyna
182
1.40
0.35
5
PLUTA Mirosław Stanisław
241
1.86
0.46
6
KOŚCIELNY Stanisław
136
1.05
0.26
7
BUTRYN Renata Celina
198
1.53
0.38
8
KOSIOROWSKI Franciszek
131
1.01
0.25
9
CYNKAR Sławomir Tadeusz
53
0.41
0.10
10
KASPEREK Romualda
4750
36.78
9.08
11
KAPAŁA Ryszard
638
4.94
1.22
12
MORYCZ Wincenty
34
0.26
0.06
13
CYRAN Tomasz Władysław
104
0.80
0.20
14
MIERZWA Artur
78
0.60
0.15
15
OŻÓG Krzysztof
208
1.61
0.40
16
CIEŚLA Marcin Daniel
124
0.96
0.24
17
WSZOŁEK Jacek Karol
81
0.62
0.15
18
ŻMUDA Dariusz
145
1.12
0.28
19
KRAWIEC Stanisław Jan
66
0.51
0.13
20
STĘPIEŃ Danuta Waleria
140
1.08
0.27
21
RĄCZY Małgorzata
51
0.39
0.10
22
MAŃKA Jan Stanisław
18
0.13
0.03
23
BUKOWSKI Dariusz
77
0.59
0.15
24
GRZYWACZ Zygmunt
26
0.20
0.05
25
CHMURA Andrzej
539
4.17
1.03
26
MĄCZKA Maria
736
5.69
1.41
27
KALANDYK Zbigniew Franciszek
21
0.16
0.04
28
GAWRYŚ Andrzej
70
0.54
0.13
29
MRYCZKO Piotr Paweł
199
1.54
0.38
30
KARKUT Michał
108
0.83
0.21
Σ
12913
100.00
24.68
.
.
Voting Results by location of ward electoral commission.
.
.
.
.
.
.
.
.
.
.
.
.
.
.
.
.
.
No.
Name
No. of entitled
to vote
No. of ballot
papers issued
No. of votes
No. of votes: per list / valid [%]
total
valid
per List
1
City
42391
24148
24127
23688
8035
33.92
2
Country
61544
29442
29421
28632
4878
17.04
.
Voting Results by number of inhabitants of commune
.
1
to 5 000
0
0
0
0
0
0.00
2
from 5 001 to 10 000
4262
1581
1581
1516
198
13.06
3
from 10 001 to 20 000
42868
20853
20832
20259
3058
15.09
4
from 20 001 to 50 000
56805
31156
31135
30545
9657
31.62
5
from 50 001 to 100 000
0
0
0
0
0
0.00
6
from 100 001 to 200 000
0
0
0
0
0
0.00
7
from 200 001 to 500 000
0
0
0
0
0
0.00
8
over 500 000
0
0
0
0
0
0.00
Legal Acts
Documents
Electoral Bodies
Election Committees and Candidates
Turnout
Results
Statistical Data
SENATE
Created by
Copyright © 2007
Mikrobit Sp. z o.o.
. All Rights Reserved.
top