.
.
Legal Acts
Documents
Electoral Bodies
Election Committees and Candidates
Turnout
Results
Statistical Data
SENATE
Created by
.
.
Voting Results
.
.
.
Voting Results for Committee
.
.
.
.
.
.
.
.
.
.
.
.
.
.
.
.
.
.
.
.
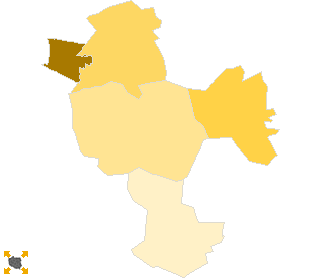
Polska
/
Lublin
/
świdnicki, pow.
...
Komitet Wyborczy Platforma Obywatelska RP
List's Number:
8
No. of valid votes:
29554
No. of votes per List:
9426
31.89%
lack
10.05%
12.89%
15.73%
18.57%
21.41%
24.25%
27.09%
29.93%
32.77%
35.61%
not
of data
12.88%
15.72%
18.56%
21.40%
24.24%
27.08%
29.92%
32.76%
35.60%
38.45%
applicable
See also:
Turnout
Votes per Lists
Votes per Candidates
Information about Election Committee
Election results
Voting Results by location of ward electoral commission
.
.
Voting Results for Committee.
.
.
.
.
.
.
.
.
.
.
.
.
.
.
.
.
.
No.
Name
No. of entitled
to vote
No. of ballot papers
issued
No. of votes
No. of votes: per list / valid [%]
total
valid
per List
061702
Mełgiew, gm.
6453
2982
2981
2945
696
23.63
061703
Piaski, gm.
8618
3751
3742
3657
615
16.82
061704
Rybczewice, gm.
3229
1315
1315
1283
129
10.05
061701
Świdnik, m.
33322
19278
19258
19068
7326
38.42
061705
Trawniki, gm.
7333
2691
2690
2601
660
25.37
świdnicki, pow.
58955
30017
29986
29554
9426
31.89
.
.
Voting Results for Candidates
.
.
.
.
.
.
.
.
.
.
.
.
.
.
.
No.
Surname Names
No. of votes
% No. of votes per candidate/No. per list
% No. of votes per candidate/No. of valid votes
1
PALIKOT Janusz
2938
31.16
9.94
2
KARPIŃSKI Włodzimierz Witold
357
3.78
1.21
3
WILK Wojciech
163
1.72
0.55
4
MUCHA Joanna
898
9.52
3.04
5
WYSOCKI Włodzimierz Antoni
111
1.17
0.38
6
KONDRAK Jan
797
8.45
2.70
7
PUDŁO Tadeusz Feliks
39
0.41
0.13
8
GĄSIOR-MAREK Magdalena Ewa
841
8.92
2.85
9
ŻUK Zofia
82
0.86
0.28
10
WOJCIECHOWSKI Zbigniew Czesław
192
2.03
0.65
11
WRÓBEL Dariusz Zygmunt
22
0.23
0.07
12
BERNECKA Agnieszka Beata
192
2.03
0.65
13
MAŁYSKA Tomasz Andrzej
22
0.23
0.07
14
BIAŁOWĄS Waldemar Franciszek
2137
22.67
7.23
15
KMITA Elżbieta Helena
43
0.45
0.15
16
RUSINEK Marcin
21
0.22
0.07
17
ŻYŚKO Robert Artur
47
0.49
0.16
18
WOJCIECHOWSKI Norbert Jan
51
0.54
0.17
19
KOMORSKI Krzysztof
64
0.67
0.22
20
ŁUCJAN Henryk
71
0.75
0.24
21
KUNCZYŃSKA Ewa Magdalena
39
0.41
0.13
22
SAWICKI Piotr Paweł
40
0.42
0.14
23
URBAN Marcin
15
0.15
0.05
24
KARDYKA Grzegorz Sebastian
73
0.77
0.25
25
KOZIEŁ Krzysztof Marek
46
0.48
0.16
26
BIGOS Jarosław
27
0.28
0.09
27
GUZ Radosław Teofil
23
0.24
0.08
28
STRYCHARCZUK Marek
16
0.16
0.05
29
PAŁYS Jan Edward
14
0.14
0.05
30
KLECHOWICZ Dariusz Władysław
45
0.47
0.15
Σ
9426
100.00
31.89
.
.
Voting Results by location of ward electoral commission.
.
.
.
.
.
.
.
.
.
.
.
.
.
.
.
.
.
No.
Name
No. of entitled
to vote
No. of ballot
papers issued
No. of votes
No. of votes: per list / valid [%]
total
valid
per List
1
City
35480
20410
20390
20178
7595
37.64
2
Country
23475
9607
9596
9376
1831
19.53
.
Voting Results by number of inhabitants of commune
.
1
to 5 000
3229
1315
1315
1283
129
10.05
2
from 5 001 to 10 000
13786
5673
5671
5546
1356
24.45
3
from 10 001 to 20 000
8618
3751
3742
3657
615
16.82
4
from 20 001 to 50 000
33322
19278
19258
19068
7326
38.42
5
from 50 001 to 100 000
0
0
0
0
0
0.00
6
from 100 001 to 200 000
0
0
0
0
0
0.00
7
from 200 001 to 500 000
0
0
0
0
0
0.00
8
over 500 000
0
0
0
0
0
0.00
Legal Acts
Documents
Electoral Bodies
Election Committees and Candidates
Turnout
Results
Statistical Data
SENATE
Created by
Copyright © 2007
Mikrobit Sp. z o.o.
. All Rights Reserved.
top