.
.
Legal Acts
Documents
Electoral Bodies
Election Committees and Candidates
Turnout
Results
Statistical Data
SENATE
Created by
.
.
Voting Results
.
.
.
Voting Results for Committee
.
.
.
.
.
.
.
.
.
.
.
.
.
.
.
.
.
.
.
.
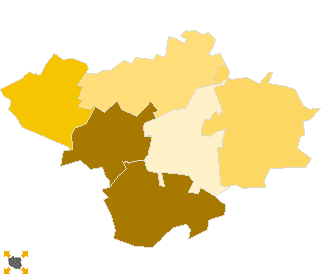
Polska
/
Lublin
/
łęczyński, pow.
...
Komitet Wyborczy Platforma Obywatelska RP
List's Number:
8
No. of valid votes:
19970
No. of votes per List:
4204
21.05%
lack
10.36%
11.77%
13.18%
14.59%
16.00%
17.41%
18.82%
20.23%
21.64%
23.05%
not
of data
11.76%
13.17%
14.58%
15.99%
17.40%
18.81%
20.22%
21.63%
23.04%
24.46%
applicable
See also:
Turnout
Votes per Lists
Votes per Candidates
Information about Election Committee
Election results
Voting Results by location of ward electoral commission
.
.
Voting Results for Committee.
.
.
.
.
.
.
.
.
.
.
.
.
.
.
.
.
.
No.
Name
No. of entitled
to vote
No. of ballot papers
issued
No. of votes
No. of votes: per list / valid [%]
total
valid
per List
061001
Cyców, gm.
5841
2393
2392
2315
393
16.98
061002
Ludwin, gm.
3792
1443
1443
1402
214
15.26
061003
Łęczna, gm.
19297
10114
10083
9921
2426
24.45
061004
Milejów, gm.
7273
2804
2804
2717
652
24.00
061005
Puchaczów, gm.
4000
2005
2005
1911
198
10.36
061006
Spiczyn, gm.
4098
1745
1745
1704
321
18.84
łęczyński, pow.
44301
20504
20472
19970
4204
21.05
.
.
Voting Results for Candidates
.
.
.
.
.
.
.
.
.
.
.
.
.
.
.
No.
Surname Names
No. of votes
% No. of votes per candidate/No. per list
% No. of votes per candidate/No. of valid votes
1
PALIKOT Janusz
1558
37.05
7.80
2
KARPIŃSKI Włodzimierz Witold
187
4.44
0.94
3
WILK Wojciech
53
1.26
0.27
4
MUCHA Joanna
642
15.27
3.21
5
WYSOCKI Włodzimierz Antoni
47
1.11
0.24
6
KONDRAK Jan
24
0.57
0.12
7
PUDŁO Tadeusz Feliks
28
0.66
0.14
8
GĄSIOR-MAREK Magdalena Ewa
706
16.79
3.54
9
ŻUK Zofia
45
1.07
0.23
10
WOJCIECHOWSKI Zbigniew Czesław
128
3.04
0.64
11
WRÓBEL Dariusz Zygmunt
16
0.38
0.08
12
BERNECKA Agnieszka Beata
154
3.66
0.77
13
MAŁYSKA Tomasz Andrzej
32
0.76
0.16
14
BIAŁOWĄS Waldemar Franciszek
12
0.28
0.06
15
KMITA Elżbieta Helena
25
0.59
0.13
16
RUSINEK Marcin
11
0.26
0.06
17
ŻYŚKO Robert Artur
11
0.26
0.06
18
WOJCIECHOWSKI Norbert Jan
56
1.33
0.28
19
KOMORSKI Krzysztof
32
0.76
0.16
20
ŁUCJAN Henryk
42
0.99
0.21
21
KUNCZYŃSKA Ewa Magdalena
30
0.71
0.15
22
SAWICKI Piotr Paweł
27
0.64
0.14
23
URBAN Marcin
13
0.30
0.07
24
KARDYKA Grzegorz Sebastian
9
0.21
0.05
25
KOZIEŁ Krzysztof Marek
19
0.45
0.10
26
BIGOS Jarosław
19
0.45
0.10
27
GUZ Radosław Teofil
14
0.33
0.07
28
STRYCHARCZUK Marek
235
5.58
1.18
29
PAŁYS Jan Edward
9
0.21
0.05
30
KLECHOWICZ Dariusz Władysław
20
0.47
0.10
Σ
4204
100.00
21.05
.
.
Voting Results by location of ward electoral commission.
.
.
.
.
.
.
.
.
.
.
.
.
.
.
.
.
.
No.
Name
No. of entitled
to vote
No. of ballot
papers issued
No. of votes
No. of votes: per list / valid [%]
total
valid
per List
1
City
16506
8928
8897
8775
2248
25.62
2
Country
27795
11576
11575
11195
1956
17.47
.
Voting Results by number of inhabitants of commune
.
1
to 5 000
4000
2005
2005
1911
198
10.36
2
from 5 001 to 10 000
21004
8385
8384
8138
1580
19.42
3
from 10 001 to 20 000
0
0
0
0
0
0.00
4
from 20 001 to 50 000
19297
10114
10083
9921
2426
24.45
5
from 50 001 to 100 000
0
0
0
0
0
0.00
6
from 100 001 to 200 000
0
0
0
0
0
0.00
7
from 200 001 to 500 000
0
0
0
0
0
0.00
8
over 500 000
0
0
0
0
0
0.00
Legal Acts
Documents
Electoral Bodies
Election Committees and Candidates
Turnout
Results
Statistical Data
SENATE
Created by
Copyright © 2007
Mikrobit Sp. z o.o.
. All Rights Reserved.
top