.
.
Legal Acts
Documents
Electoral Bodies
Election Committees and Candidates
Turnout
Results
Statistical Data
SENATE
Created by
.
.
Voting Results
.
.
.
Voting Results for Committee
.
.
.
.
.
.
.
.
.
.
.
.
.
.
.
.
.
.
.
.
Polska
/
Bydgoszcz
/
żniński, pow.
...
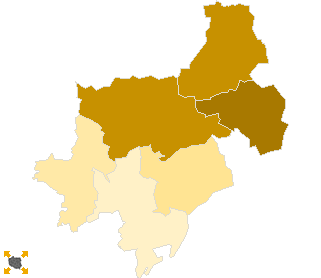
Komitet Wyborczy Platforma Obywatelska RP
List's Number:
8
No. of valid votes:
25621
No. of votes per List:
8681
33.88%
lack
17.66%
20.09%
22.52%
24.95%
27.38%
29.81%
32.24%
34.67%
37.10%
39.53%
not
of data
20.08%
22.51%
24.94%
27.37%
29.80%
32.23%
34.66%
37.09%
39.52%
41.96%
applicable
See also:
Turnout
Votes per Lists
Votes per Candidates
Information about Election Committee
Election results
Voting Results by location of ward electoral commission
.
.
Voting Results for Committee.
.
.
.
.
.
.
.
.
.
.
.
.
.
.
.
.
.
No.
Name
No. of entitled
to vote
No. of ballot papers
issued
No. of votes
No. of votes: per list / valid [%]
total
valid
per List
041901
Barcin, gm.
11712
5471
5457
5338
2235
41.87
041902
Gąsawa, gm.
4109
1920
1920
1851
434
23.45
041903
Janowiec Wielkopolski, gm.
7497
3418
3416
3258
729
22.38
041904
Łabiszyn, gm.
7261
3253
3253
3159
1185
37.51
041905
Rogowo, gm.
5373
2791
2791
2655
469
17.66
041906
Żnin, gm.
19364
9709
9706
9360
3629
38.77
żniński, pow.
55316
26562
26543
25621
8681
33.88
.
.
Voting Results for Candidates
.
.
.
.
.
.
.
.
.
.
.
.
.
.
.
No.
Surname Names
No. of votes
% No. of votes per candidate/No. per list
% No. of votes per candidate/No. of valid votes
1
SIKORSKI Radosław Tomasz
3465
39.91
13.52
2
OLSZEWSKI Paweł Bartosz
290
3.34
1.13
3
PIOTROWSKA Teresa
394
4.53
1.54
4
KATULSKI Jarosław Paweł
110
1.26
0.43
5
ROSZAK Grzegorz Michał
145
1.67
0.57
6
WITOWSKA - ARASZKIEWICZ Alicja
102
1.17
0.40
7
DROZDOWSKI Stanisław
91
1.04
0.36
8
KOZŁOWSKA Iwona Maria
303
3.49
1.18
9
NOWAKOWSKA Aleksandra Bogumiła
2841
32.72
11.09
10
GRZEGOREK Zenon
34
0.39
0.13
11
GAWRYCH Józef Jerzy
37
0.42
0.14
12
MICHALAK Artur Jan
63
0.72
0.25
13
FRONCZEK Zbigniew Antoni
48
0.55
0.19
14
PIÓRKOWSKA Anna Teresa
62
0.71
0.24
15
KOWALSKI Łukasz
66
0.76
0.26
16
RÓŻAŃSKA - MAJCHRZAK Bernadeta Aldona
58
0.66
0.23
17
ZIELIŃSKI Andrzej
48
0.55
0.19
18
CASTILLO Hector Huilca
53
0.61
0.21
19
KOWALSKA Joanna
84
0.96
0.33
20
MARKS Stanisław Marian
35
0.40
0.14
21
ZALEWSKA Katarzyna Joanna
53
0.61
0.21
22
NAJZER Piotr Zbigniew
45
0.51
0.18
23
SOBALA Grzegorz
23
0.26
0.09
24
BREJZA Krzysztof
231
2.66
0.90
Σ
8681
100.00
33.88
.
.
Voting Results by location of ward electoral commission.
.
.
.
.
.
.
.
.
.
.
.
.
.
.
.
.
.
No.
Name
No. of entitled
to vote
No. of ballot
papers issued
No. of votes
No. of votes: per list / valid [%]
total
valid
per List
1
City
25109
13165
13148
12750
5337
41.86
2
Country
30207
13397
13395
12871
3344
25.98
.
Voting Results by number of inhabitants of commune
.
1
to 5 000
0
0
0
0
0
0.00
2
from 5 001 to 10 000
24240
11382
11380
10923
2817
25.79
3
from 10 001 to 20 000
11712
5471
5457
5338
2235
41.87
4
from 20 001 to 50 000
19364
9709
9706
9360
3629
38.77
5
from 50 001 to 100 000
0
0
0
0
0
0.00
6
from 100 001 to 200 000
0
0
0
0
0
0.00
7
from 200 001 to 500 000
0
0
0
0
0
0.00
8
over 500 000
0
0
0
0
0
0.00
Legal Acts
Documents
Electoral Bodies
Election Committees and Candidates
Turnout
Results
Statistical Data
SENATE
Created by
Copyright © 2007
Mikrobit Sp. z o.o.
. All Rights Reserved.
top