.
.
Legal Acts
Documents
Electoral Bodies
Election Committees and Candidates
Turnout
Results
Statistical Data
SENATE
Created by
.
.
Voting Results
.
.
.
Voting Results for Committee
.
.
.
.
.
.
.
.
.
.
.
.
.
.
.
.
.
.
.
.
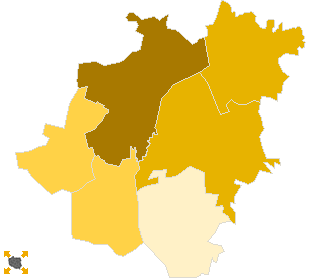
Polska
/
Bydgoszcz
/
tucholski, pow.
...
Komitet Wyborczy Platforma Obywatelska RP
List's Number:
8
No. of valid votes:
17287
No. of votes per List:
6276
36.30%
lack
18.31%
20.79%
23.27%
25.75%
28.23%
30.71%
33.19%
35.67%
38.15%
40.63%
not
of data
20.78%
23.26%
25.74%
28.22%
30.70%
33.18%
35.66%
38.14%
40.62%
43.11%
applicable
See also:
Turnout
Votes per Lists
Votes per Candidates
Information about Election Committee
Election results
Voting Results by location of ward electoral commission
.
.
Voting Results for Committee.
.
.
.
.
.
.
.
.
.
.
.
.
.
.
.
.
.
No.
Name
No. of entitled
to vote
No. of ballot papers
issued
No. of votes
No. of votes: per list / valid [%]
total
valid
per List
041601
Cekcyn, gm.
5047
2340
2340
2251
808
35.90
041602
Gostycyn, gm.
4069
1893
1884
1842
605
32.84
041603
Kęsowo, gm.
3412
1413
1413
1317
419
31.81
041604
Lubiewo, gm.
4347
2327
2327
2195
402
18.31
041605
Śliwice, gm.
4127
1923
1923
1845
668
36.21
041606
Tuchola, gm.
15612
8069
8069
7837
3374
43.05
tucholski, pow.
36614
17965
17956
17287
6276
36.30
.
.
Voting Results for Candidates
.
.
.
.
.
.
.
.
.
.
.
.
.
.
.
No.
Surname Names
No. of votes
% No. of votes per candidate/No. per list
% No. of votes per candidate/No. of valid votes
1
SIKORSKI Radosław Tomasz
1007
16.04
5.83
2
OLSZEWSKI Paweł Bartosz
73
1.16
0.42
3
PIOTROWSKA Teresa
170
2.70
0.98
4
KATULSKI Jarosław Paweł
4618
73.58
26.71
5
ROSZAK Grzegorz Michał
18
0.28
0.10
6
WITOWSKA - ARASZKIEWICZ Alicja
30
0.47
0.17
7
DROZDOWSKI Stanisław
20
0.31
0.12
8
KOZŁOWSKA Iwona Maria
51
0.81
0.30
9
NOWAKOWSKA Aleksandra Bogumiła
20
0.31
0.12
10
GRZEGOREK Zenon
13
0.20
0.08
11
GAWRYCH Józef Jerzy
12
0.19
0.07
12
MICHALAK Artur Jan
34
0.54
0.20
13
FRONCZEK Zbigniew Antoni
21
0.33
0.12
14
PIÓRKOWSKA Anna Teresa
22
0.35
0.13
15
KOWALSKI Łukasz
36
0.57
0.21
16
RÓŻAŃSKA - MAJCHRZAK Bernadeta Aldona
12
0.19
0.07
17
ZIELIŃSKI Andrzej
24
0.38
0.14
18
CASTILLO Hector Huilca
24
0.38
0.14
19
KOWALSKA Joanna
24
0.38
0.14
20
MARKS Stanisław Marian
13
0.20
0.08
21
ZALEWSKA Katarzyna Joanna
14
0.22
0.08
22
NAJZER Piotr Zbigniew
0
0.00
0.00
23
SOBALA Grzegorz
3
0.04
0.02
24
BREJZA Krzysztof
17
0.27
0.10
Σ
6276
100.00
36.30
.
.
Voting Results by location of ward electoral commission.
.
.
.
.
.
.
.
.
.
.
.
.
.
.
.
.
.
No.
Name
No. of entitled
to vote
No. of ballot
papers issued
No. of votes
No. of votes: per list / valid [%]
total
valid
per List
1
City
11141
6193
6193
6053
2824
46.65
2
Country
25473
11772
11763
11234
3452
30.73
.
Voting Results by number of inhabitants of commune
.
1
to 5 000
3412
1413
1413
1317
419
31.81
2
from 5 001 to 10 000
17590
8483
8474
8133
2483
30.53
3
from 10 001 to 20 000
0
0
0
0
0
0.00
4
from 20 001 to 50 000
15612
8069
8069
7837
3374
43.05
5
from 50 001 to 100 000
0
0
0
0
0
0.00
6
from 100 001 to 200 000
0
0
0
0
0
0.00
7
from 200 001 to 500 000
0
0
0
0
0
0.00
8
over 500 000
0
0
0
0
0
0.00
Legal Acts
Documents
Electoral Bodies
Election Committees and Candidates
Turnout
Results
Statistical Data
SENATE
Created by
Copyright © 2007
Mikrobit Sp. z o.o.
. All Rights Reserved.
top