.
.
Legal Acts
Documents
Electoral Bodies
Election Committees and Candidates
Turnout
Results
Statistical Data
SENATE
Created by
.
.
Voting Results
.
.
.
Voting Results for Committee
.
.
.
.
.
.
.
.
.
.
.
.
.
.
.
.
.
.
.
.
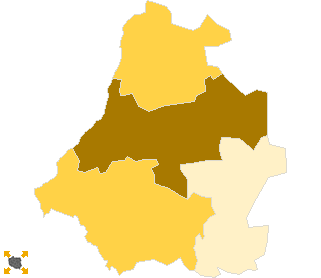
Polska
/
Bydgoszcz
/
sępoleński, pow.
...
Komitet Wyborczy Platforma Obywatelska RP
List's Number:
8
No. of valid votes:
13994
No. of votes per List:
4931
35.24%
lack
21.43%
23.46%
25.49%
27.52%
29.55%
31.58%
33.61%
35.64%
37.67%
39.70%
not
of data
23.45%
25.48%
27.51%
29.54%
31.57%
33.60%
35.63%
37.66%
39.69%
41.73%
applicable
See also:
Turnout
Votes per Lists
Votes per Candidates
Information about Election Committee
Election results
Voting Results by location of ward electoral commission
.
.
Voting Results for Committee.
.
.
.
.
.
.
.
.
.
.
.
.
.
.
.
.
.
No.
Name
No. of entitled
to vote
No. of ballot papers
issued
No. of votes
No. of votes: per list / valid [%]
total
valid
per List
041301
Kamień Krajeński, gm.
5317
2233
2233
2124
698
32.86
041302
Sępólno Krajeńskie, gm.
12524
5928
5927
5758
2400
41.68
041303
Sośno, gm.
4022
1612
1612
1549
332
21.43
041304
Więcbork, gm.
10316
4692
4689
4563
1501
32.90
sępoleński, pow.
32179
14465
14461
13994
4931
35.24
.
.
Voting Results for Candidates
.
.
.
.
.
.
.
.
.
.
.
.
.
.
.
No.
Surname Names
No. of votes
% No. of votes per candidate/No. per list
% No. of votes per candidate/No. of valid votes
1
SIKORSKI Radosław Tomasz
2145
43.50
15.33
2
OLSZEWSKI Paweł Bartosz
177
3.58
1.26
3
PIOTROWSKA Teresa
221
4.48
1.58
4
KATULSKI Jarosław Paweł
290
5.88
2.07
5
ROSZAK Grzegorz Michał
43
0.87
0.31
6
WITOWSKA - ARASZKIEWICZ Alicja
53
1.07
0.38
7
DROZDOWSKI Stanisław
1113
22.57
7.95
8
KOZŁOWSKA Iwona Maria
364
7.38
2.60
9
NOWAKOWSKA Aleksandra Bogumiła
61
1.23
0.44
10
GRZEGOREK Zenon
18
0.36
0.13
11
GAWRYCH Józef Jerzy
24
0.48
0.17
12
MICHALAK Artur Jan
32
0.64
0.23
13
FRONCZEK Zbigniew Antoni
36
0.73
0.26
14
PIÓRKOWSKA Anna Teresa
21
0.42
0.15
15
KOWALSKI Łukasz
44
0.89
0.31
16
RÓŻAŃSKA - MAJCHRZAK Bernadeta Aldona
32
0.64
0.23
17
ZIELIŃSKI Andrzej
40
0.81
0.29
18
CASTILLO Hector Huilca
31
0.62
0.22
19
KOWALSKA Joanna
38
0.77
0.27
20
MARKS Stanisław Marian
11
0.22
0.08
21
ZALEWSKA Katarzyna Joanna
44
0.89
0.31
22
NAJZER Piotr Zbigniew
7
0.14
0.05
23
SOBALA Grzegorz
17
0.34
0.12
24
BREJZA Krzysztof
69
1.39
0.49
Σ
4931
100.00
35.23
.
.
Voting Results by location of ward electoral commission.
.
.
.
.
.
.
.
.
.
.
.
.
.
.
.
.
.
No.
Name
No. of entitled
to vote
No. of ballot
papers issued
No. of votes
No. of votes: per list / valid [%]
total
valid
per List
1
City
15341
7807
7805
7556
3239
42.87
2
Country
16838
6658
6656
6438
1692
26.28
.
Voting Results by number of inhabitants of commune
.
1
to 5 000
0
0
0
0
0
0.00
2
from 5 001 to 10 000
9339
3845
3845
3673
1030
28.04
3
from 10 001 to 20 000
22840
10620
10616
10321
3901
37.80
4
from 20 001 to 50 000
0
0
0
0
0
0.00
5
from 50 001 to 100 000
0
0
0
0
0
0.00
6
from 100 001 to 200 000
0
0
0
0
0
0.00
7
from 200 001 to 500 000
0
0
0
0
0
0.00
8
over 500 000
0
0
0
0
0
0.00
Legal Acts
Documents
Electoral Bodies
Election Committees and Candidates
Turnout
Results
Statistical Data
SENATE
Created by
Copyright © 2007
Mikrobit Sp. z o.o.
. All Rights Reserved.
top