.
.
Legal Acts
Documents
Electoral Bodies
Election Committees and Candidates
Turnout
Results
Statistical Data
SENATE
Created by
.
.
Voting Results
.
.
.
Voting Results for Committee
.
.
.
.
.
.
.
.
.
.
.
.
.
.
.
.
.
.
.
.
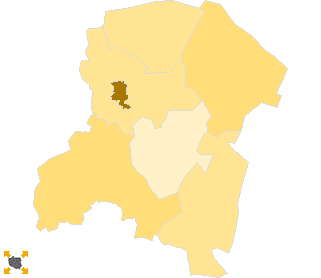
Polska
/
Toruń
/
radziejowski, pow.
...
Komitet Wyborczy Platforma Obywatelska RP
List's Number:
8
No. of valid votes:
13082
No. of votes per List:
3444
26.33%
lack
15.07%
17.75%
20.43%
23.11%
25.79%
28.47%
31.15%
33.83%
36.51%
39.19%
not
of data
17.74%
20.42%
23.10%
25.78%
28.46%
31.14%
33.82%
36.50%
39.18%
41.87%
applicable
See also:
Turnout
Votes per Lists
Votes per Candidates
Information about Election Committee
Election results
Voting Results by location of ward electoral commission
.
.
Voting Results for Committee.
.
.
.
.
.
.
.
.
.
.
.
.
.
.
.
.
.
No.
Name
No. of entitled
to vote
No. of ballot papers
issued
No. of votes
No. of votes: per list / valid [%]
total
valid
per List
041102
Bytoń, gm.
3035
1112
1111
1068
161
15.07
041103
Dobre, gm.
4441
1750
1750
1676
386
23.03
041104
Osięciny, gm.
6551
2365
2363
2290
587
25.63
041105
Piotrków Kujawski, gm.
7664
2992
2989
2875
675
23.48
041106
Radziejów, gm.
3496
1275
1252
1212
261
21.53
041101
Radziejów, m.
5027
2551
2547
2466
1031
41.81
041107
Topólka, gm.
4056
1547
1547
1495
343
22.94
radziejowski, pow.
34270
13592
13559
13082
3444
26.33
.
.
Voting Results for Candidates
.
.
.
.
.
.
.
.
.
.
.
.
.
.
.
No.
Surname Names
No. of votes
% No. of votes per candidate/No. per list
% No. of votes per candidate/No. of valid votes
1
MĘŻYDŁO Antoni
839
24.36
6.41
2
LENZ Tomasz
103
2.99
0.79
3
KOPACZEWSKA Domicela Katarzyna
554
16.08
4.23
4
DZIĘCIOŁ Janusz
131
3.80
1.00
5
KARPIŃSKI Grzegorz
79
2.29
0.60
6
WOJTKOWSKI Marek
220
6.38
1.68
7
PĄCZKOWSKI Mirosław
35
1.01
0.27
8
TASARZ Roman Stefan
14
0.40
0.11
9
SZYMAŃSKI Tomasz Józef
61
1.77
0.47
10
BARTOSZEK Maciej
48
1.39
0.37
11
RAKOWICZ Andrzej Jarosław
12
0.34
0.09
12
KANIA Barbara Danuta
71
2.06
0.54
13
PIOTROWSKI Hubert Andrzej
46
1.33
0.35
14
OLIWKIEWICZ Jarosław Edward
20
0.58
0.15
15
SKIBA Mariusz
35
1.01
0.27
16
ZALESKI Jerzy
36
1.04
0.28
17
SZYMAŃSKI Wojciech
26
0.75
0.20
18
LEWANDOWSKI Tomasz Andrzej
56
1.62
0.43
19
BOGDAŃSKI Wiesław
276
8.01
2.11
20
JAŁOSZYŃSKI Dariusz
639
18.55
4.88
21
WOJCIECHOWSKI Kazimierz Andrzej
28
0.81
0.21
22
RUCKA-LA CASSE Ewa
37
1.07
0.28
23
HAK Jacek
12
0.34
0.09
24
MOCNY Zenon
34
0.98
0.26
25
REK Marcin Mieczysław
9
0.26
0.07
26
KULERSKI Piotr
23
0.66
0.18
Σ
3444
100.00
26.32
.
.
Voting Results by location of ward electoral commission.
.
.
.
.
.
.
.
.
.
.
.
.
.
.
.
.
.
No.
Name
No. of entitled
to vote
No. of ballot
papers issued
No. of votes
No. of votes: per list / valid [%]
total
valid
per List
1
City
8596
4173
4167
4033
1487
36.87
2
Country
25674
9419
9392
9049
1957
21.63
.
Voting Results by number of inhabitants of commune
.
1
to 5 000
6531
2387
2363
2280
422
18.51
2
from 5 001 to 10 000
27739
11205
11196
10802
3022
27.98
3
from 10 001 to 20 000
0
0
0
0
0
0.00
4
from 20 001 to 50 000
0
0
0
0
0
0.00
5
from 50 001 to 100 000
0
0
0
0
0
0.00
6
from 100 001 to 200 000
0
0
0
0
0
0.00
7
from 200 001 to 500 000
0
0
0
0
0
0.00
8
over 500 000
0
0
0
0
0
0.00
Legal Acts
Documents
Electoral Bodies
Election Committees and Candidates
Turnout
Results
Statistical Data
SENATE
Created by
Copyright © 2007
Mikrobit Sp. z o.o.
. All Rights Reserved.
top