.
.
Legal Acts
Documents
Electoral Bodies
Election Committees and Candidates
Turnout
Results
Statistical Data
SENATE
Created by
.
.
Voting Results
.
.
.
Voting Results for Committee
.
.
.
.
.
.
.
.
.
.
.
.
.
.
.
.
.
.
.
.
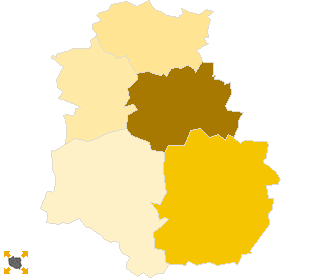
Polska
/
Bydgoszcz
/
nakielski, pow.
...
Komitet Wyborczy Platforma Obywatelska RP
List's Number:
8
No. of valid votes:
31786
No. of votes per List:
13617
42.84%
lack
31.10%
33.01%
34.92%
36.83%
38.74%
40.65%
42.56%
44.47%
46.38%
48.29%
not
of data
33.00%
34.91%
36.82%
38.73%
40.64%
42.55%
44.46%
46.37%
48.28%
50.20%
applicable
See also:
Turnout
Votes per Lists
Votes per Candidates
Information about Election Committee
Election results
Voting Results by location of ward electoral commission
.
.
Voting Results for Committee.
.
.
.
.
.
.
.
.
.
.
.
.
.
.
.
.
.
No.
Name
No. of entitled
to vote
No. of ballot papers
issued
No. of votes
No. of votes: per list / valid [%]
total
valid
per List
041001
Kcynia, gm.
10628
4842
4842
4659
1449
31.10
041002
Mrocza, gm.
6912
3066
3065
2946
1043
35.40
041003
Nakło nad Notecią, gm.
26792
13784
13784
13456
6745
50.13
041004
Sadki, gm.
5499
2415
2415
2333
783
33.56
041005
Szubin, gm.
17611
8623
8620
8392
3597
42.86
nakielski, pow.
67442
32730
32726
31786
13617
42.84
.
.
Voting Results for Candidates
.
.
.
.
.
.
.
.
.
.
.
.
.
.
.
No.
Surname Names
No. of votes
% No. of votes per candidate/No. per list
% No. of votes per candidate/No. of valid votes
1
SIKORSKI Radosław Tomasz
9314
68.39
29.30
2
OLSZEWSKI Paweł Bartosz
440
3.23
1.38
3
PIOTROWSKA Teresa
646
4.74
2.03
4
KATULSKI Jarosław Paweł
102
0.74
0.32
5
ROSZAK Grzegorz Michał
95
0.69
0.30
6
WITOWSKA - ARASZKIEWICZ Alicja
131
0.96
0.41
7
DROZDOWSKI Stanisław
72
0.52
0.23
8
KOZŁOWSKA Iwona Maria
158
1.16
0.50
9
NOWAKOWSKA Aleksandra Bogumiła
101
0.74
0.32
10
GRZEGOREK Zenon
1332
9.78
4.19
11
GAWRYCH Józef Jerzy
62
0.45
0.20
12
MICHALAK Artur Jan
273
2.00
0.86
13
FRONCZEK Zbigniew Antoni
64
0.47
0.20
14
PIÓRKOWSKA Anna Teresa
82
0.60
0.26
15
KOWALSKI Łukasz
77
0.56
0.24
16
RÓŻAŃSKA - MAJCHRZAK Bernadeta Aldona
63
0.46
0.20
17
ZIELIŃSKI Andrzej
86
0.63
0.27
18
CASTILLO Hector Huilca
76
0.55
0.24
19
KOWALSKA Joanna
92
0.67
0.29
20
MARKS Stanisław Marian
162
1.18
0.51
21
ZALEWSKA Katarzyna Joanna
57
0.41
0.18
22
NAJZER Piotr Zbigniew
18
0.13
0.06
23
SOBALA Grzegorz
39
0.28
0.12
24
BREJZA Krzysztof
75
0.55
0.24
Σ
13617
100.00
42.83
.
.
Voting Results by location of ward electoral commission.
.
.
.
.
.
.
.
.
.
.
.
.
.
.
.
.
.
No.
Name
No. of entitled
to vote
No. of ballot
papers issued
No. of votes
No. of votes: per list / valid [%]
total
valid
per List
1
City
32505
17270
17266
16780
8191
48.81
2
Country
34937
15460
15460
15006
5426
36.16
.
Voting Results by number of inhabitants of commune
.
1
to 5 000
0
0
0
0
0
0.00
2
from 5 001 to 10 000
12411
5481
5480
5279
1826
34.59
3
from 10 001 to 20 000
10628
4842
4842
4659
1449
31.10
4
from 20 001 to 50 000
44403
22407
22404
21848
10342
47.34
5
from 50 001 to 100 000
0
0
0
0
0
0.00
6
from 100 001 to 200 000
0
0
0
0
0
0.00
7
from 200 001 to 500 000
0
0
0
0
0
0.00
8
over 500 000
0
0
0
0
0
0.00
Legal Acts
Documents
Electoral Bodies
Election Committees and Candidates
Turnout
Results
Statistical Data
SENATE
Created by
Copyright © 2007
Mikrobit Sp. z o.o.
. All Rights Reserved.
top