.
.
Legal Acts
Documents
Electoral Bodies
Election Committees and Candidates
Turnout
Results
Statistical Data
SENATE
Created by
.
.
Voting Results
.
.
.
Voting Results for Committee
.
.
.
.
.
.
.
.
.
.
.
.
.
.
.
.
.
.
.
.
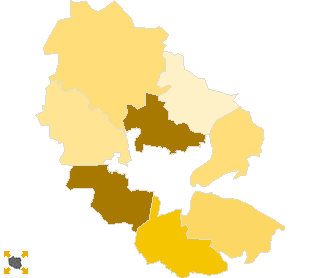
Polska
/
Bydgoszcz
/
bydgoski, pow.
...
Komitet Wyborczy Platforma Obywatelska RP
List's Number:
8
No. of valid votes:
37570
No. of votes per List:
17197
45.77%
lack
34.34%
36.55%
38.76%
40.97%
43.18%
45.39%
47.60%
49.81%
52.02%
54.23%
not
of data
36.54%
38.75%
40.96%
43.17%
45.38%
47.59%
49.80%
52.01%
54.22%
56.44%
applicable
See also:
Turnout
Votes per Lists
Votes per Candidates
Information about Election Committee
Election results
Voting Results by location of ward electoral commission
.
.
Voting Results for Committee.
.
.
.
.
.
.
.
.
.
.
.
.
.
.
.
.
.
No.
Name
No. of entitled
to vote
No. of ballot papers
issued
No. of votes
No. of votes: per list / valid [%]
total
valid
per List
040301
Białe Błota, gm.
10962
6423
6416
6335
3531
55.74
040302
Dąbrowa Chełmińska, gm.
5438
2376
2376
2299
944
41.06
040303
Dobrcz, gm.
7214
3457
3457
3331
1144
34.34
040304
Koronowo, gm.
18842
8663
8662
8400
3472
41.33
040305
Nowa Wieś Wielka, gm.
6287
3072
3069
3002
1437
47.87
040306
Osielsko, gm.
7129
4565
4564
4489
2531
56.38
040307
Sicienko, gm.
7066
3332
3332
3222
1310
40.66
040308
Solec Kujawski, gm.
12509
6639
6639
6492
2828
43.56
bydgoski, pow.
75447
38527
38515
37570
17197
45.77
.
.
Voting Results for Candidates
.
.
.
.
.
.
.
.
.
.
.
.
.
.
.
No.
Surname Names
No. of votes
% No. of votes per candidate/No. per list
% No. of votes per candidate/No. of valid votes
1
SIKORSKI Radosław Tomasz
11351
66.00
30.21
2
OLSZEWSKI Paweł Bartosz
919
5.34
2.45
3
PIOTROWSKA Teresa
1215
7.06
3.23
4
KATULSKI Jarosław Paweł
1009
5.86
2.69
5
ROSZAK Grzegorz Michał
176
1.02
0.47
6
WITOWSKA - ARASZKIEWICZ Alicja
459
2.66
1.22
7
DROZDOWSKI Stanisław
63
0.36
0.17
8
KOZŁOWSKA Iwona Maria
151
0.87
0.40
9
NOWAKOWSKA Aleksandra Bogumiła
93
0.54
0.25
10
GRZEGOREK Zenon
70
0.40
0.19
11
GAWRYCH Józef Jerzy
50
0.29
0.13
12
MICHALAK Artur Jan
142
0.82
0.38
13
FRONCZEK Zbigniew Antoni
123
0.71
0.33
14
PIÓRKOWSKA Anna Teresa
159
0.92
0.42
15
KOWALSKI Łukasz
82
0.47
0.22
16
RÓŻAŃSKA - MAJCHRZAK Bernadeta Aldona
90
0.52
0.24
17
ZIELIŃSKI Andrzej
73
0.42
0.19
18
CASTILLO Hector Huilca
143
0.83
0.38
19
KOWALSKA Joanna
93
0.54
0.25
20
MARKS Stanisław Marian
239
1.38
0.64
21
ZALEWSKA Katarzyna Joanna
89
0.51
0.24
22
NAJZER Piotr Zbigniew
199
1.15
0.53
23
SOBALA Grzegorz
41
0.23
0.11
24
BREJZA Krzysztof
168
0.97
0.45
Σ
17197
100.00
45.77
.
.
Voting Results by location of ward electoral commission.
.
.
.
.
.
.
.
.
.
.
.
.
.
.
.
.
.
No.
Name
No. of entitled
to vote
No. of ballot
papers issued
No. of votes
No. of votes: per list / valid [%]
total
valid
per List
1
City
22372
11858
11857
11587
5528
47.71
2
Country
53075
26669
26658
25983
11669
44.91
.
Voting Results by number of inhabitants of commune
.
1
to 5 000
0
0
0
0
0
0.00
2
from 5 001 to 10 000
33134
16802
16798
16343
7366
45.07
3
from 10 001 to 20 000
23471
13062
13055
12827
6359
49.58
4
from 20 001 to 50 000
18842
8663
8662
8400
3472
41.33
5
from 50 001 to 100 000
0
0
0
0
0
0.00
6
from 100 001 to 200 000
0
0
0
0
0
0.00
7
from 200 001 to 500 000
0
0
0
0
0
0.00
8
over 500 000
0
0
0
0
0
0.00
Legal Acts
Documents
Electoral Bodies
Election Committees and Candidates
Turnout
Results
Statistical Data
SENATE
Created by
Copyright © 2007
Mikrobit Sp. z o.o.
. All Rights Reserved.
top