.
.
Legal Acts
Documents
Electoral Bodies
Election Committees and Candidates
Turnout
Results
Statistical Data
SENATE
Created by
.
.
Voting Results
.
.
.
Voting Results for Committee
.
.
.
.
.
.
.
.
.
.
.
.
.
.
.
.
.
.
.
.
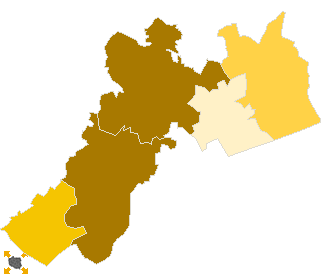
Polska
/
Szczecin
/
myśliborski, pow.
...
Komitet Wyborczy Prawo i Sprawiedliwość
List's Number:
6
No. of valid votes:
23820
No. of votes per List:
5712
23.98%
lack
20.20%
20.67%
21.14%
21.61%
22.08%
22.55%
23.02%
23.49%
23.96%
24.43%
not
of data
20.66%
21.13%
21.60%
22.07%
22.54%
23.01%
23.48%
23.95%
24.42%
24.90%
applicable
See also:
Turnout
Votes per Lists
Votes per Candidates
Information about Election Committee
Election results
Voting Results by location of ward electoral commission
.
.
Voting Results for Committee.
.
.
.
.
.
.
.
.
.
.
.
.
.
.
.
.
.
No.
Name
No. of entitled
to vote
No. of ballot papers
issued
No. of votes
No. of votes: per list / valid [%]
total
valid
per List
321001
Barlinek, gm.
15600
7337
7304
7167
1649
23.01
321002
Boleszkowice, gm.
2238
901
901
864
200
23.15
321003
Dębno, gm.
16509
7789
7782
7626
1896
24.86
321004
Myślibórz, gm.
16789
7409
7381
7193
1771
24.62
321005
Nowogródek Pomorski, gm.
2555
1013
1013
970
196
20.21
myśliborski, pow.
53691
24449
24381
23820
5712
23.98
.
.
Voting Results for Candidates
.
.
.
.
.
.
.
.
.
.
.
.
.
.
.
No.
Surname Names
No. of votes
% No. of votes per candidate/No. per list
% No. of votes per candidate/No. of valid votes
1
BRUDZIŃSKI Joachim Stanisław
1418
24.82
5.95
2
KOMOŁOWSKI Longin
560
9.80
2.35
3
DOBRZYŃSKI Leszek
179
3.13
0.75
4
JACH Michał
80
1.40
0.34
5
MASŁOWSKA Mirosława Jolanta
225
3.93
0.94
6
DRZAZGA Kazimierz
143
2.50
0.60
7
SAWARYN Mieczysław Edward
35
0.61
0.15
8
BIERNAT Stefania Elżbieta
106
1.85
0.45
9
MROZEK Andrzej
46
0.80
0.19
10
SZYMAŃSKA Halina Barbara
148
2.59
0.62
11
KŁOS Dariusz Janusz
77
1.34
0.32
12
BARTNIK Lech Jan
43
0.75
0.18
13
SOSIN Krzysztof
51
0.89
0.21
14
WOJTKIEWICZ Wojciech Witold
1175
20.57
4.93
15
BRZOZOWSKI Sławomir Stanisław
214
3.74
0.90
16
ZASADZKI Włodzimierz Andrzej
14
0.24
0.06
17
ADAMSKI Euzebiusz Sylwester
25
0.43
0.10
18
KOPEĆ Maciej Stanisław
64
1.12
0.27
19
TEREBECKI Bogdan
13
0.22
0.05
20
KIELIBA Leokadia Grażyna
18
0.31
0.08
21
WOJCIECHOWSKA Bożena
89
1.55
0.37
22
MAGDA Jan
29
0.50
0.12
23
STĘPIEŃ Stanisław
110
1.92
0.46
24
BRZOZOWSKI Andrzej
674
11.79
2.83
25
SROKA Zbigniew Kazimierz
36
0.63
0.15
26
KOPACKA Marzena Teresa
140
2.45
0.59
Σ
5712
100.00
23.97
.
.
Voting Results by location of ward electoral commission.
.
.
.
.
.
.
.
.
.
.
.
.
.
.
.
.
.
No.
Name
No. of entitled
to vote
No. of ballot
papers issued
No. of votes
No. of votes: per list / valid [%]
total
valid
per List
1
City
32997
16673
16624
16307
4007
24.57
2
Country
20694
7776
7757
7513
1705
22.69
.
Voting Results by number of inhabitants of commune
.
1
to 5 000
4793
1914
1914
1834
396
21.59
2
from 5 001 to 10 000
0
0
0
0
0
0.00
3
from 10 001 to 20 000
15600
7337
7304
7167
1649
23.01
4
from 20 001 to 50 000
33298
15198
15163
14819
3667
24.75
5
from 50 001 to 100 000
0
0
0
0
0
0.00
6
from 100 001 to 200 000
0
0
0
0
0
0.00
7
from 200 001 to 500 000
0
0
0
0
0
0.00
8
over 500 000
0
0
0
0
0
0.00
Legal Acts
Documents
Electoral Bodies
Election Committees and Candidates
Turnout
Results
Statistical Data
SENATE
Created by
Copyright © 2007
Mikrobit Sp. z o.o.
. All Rights Reserved.
top