.
.
Legal Acts
Documents
Electoral Bodies
Election Committees and Candidates
Turnout
Results
Statistical Data
SENATE
Created by
.
.
Voting Results
.
.
.
Voting Results for Committee
.
.
.
.
.
.
.
.
.
.
.
.
.
.
.
.
.
.
.
.
Polska
/
Szczecin
/
gryficki, pow.
...
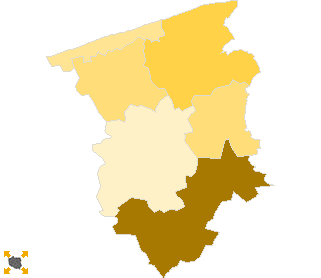
Komitet Wyborczy Prawo i Sprawiedliwość
List's Number:
6
No. of valid votes:
22301
No. of votes per List:
4166
18.68%
lack
17.49%
17.86%
18.23%
18.60%
18.97%
19.34%
19.71%
20.08%
20.45%
20.82%
not
of data
17.85%
18.22%
18.59%
18.96%
19.33%
19.70%
20.07%
20.44%
20.81%
21.19%
applicable
See also:
Turnout
Votes per Lists
Votes per Candidates
Information about Election Committee
Election results
Voting Results by location of ward electoral commission
.
.
Voting Results for Committee.
.
.
.
.
.
.
.
.
.
.
.
.
.
.
.
.
.
No.
Name
No. of entitled
to vote
No. of ballot papers
issued
No. of votes
No. of votes: per list / valid [%]
total
valid
per List
320501
Brojce, gm.
2899
1030
1030
990
185
18.69
320502
Gryfice, gm.
19246
9689
9682
9492
1661
17.50
320503
Karnice, gm.
3296
1446
1445
1386
259
18.69
320504
Płoty, gm.
7305
3088
3064
2976
629
21.14
320507
Rewal, gm.
2959
1850
1850
1815
335
18.46
320508
Trzebiatów, gm.
13245
5902
5891
5642
1097
19.44
gryficki, pow.
48950
23005
22962
22301
4166
18.68
.
.
Voting Results for Candidates
.
.
.
.
.
.
.
.
.
.
.
.
.
.
.
No.
Surname Names
No. of votes
% No. of votes per candidate/No. per list
% No. of votes per candidate/No. of valid votes
1
BRUDZIŃSKI Joachim Stanisław
1245
29.88
5.58
2
KOMOŁOWSKI Longin
410
9.84
1.84
3
DOBRZYŃSKI Leszek
158
3.79
0.71
4
JACH Michał
45
1.08
0.20
5
MASŁOWSKA Mirosława Jolanta
319
7.65
1.43
6
DRZAZGA Kazimierz
113
2.71
0.51
7
SAWARYN Mieczysław Edward
34
0.81
0.15
8
BIERNAT Stefania Elżbieta
78
1.87
0.35
9
MROZEK Andrzej
43
1.03
0.19
10
SZYMAŃSKA Halina Barbara
171
4.10
0.77
11
KŁOS Dariusz Janusz
50
1.20
0.22
12
BARTNIK Lech Jan
56
1.34
0.25
13
SOSIN Krzysztof
33
0.79
0.15
14
WOJTKIEWICZ Wojciech Witold
33
0.79
0.15
15
BRZOZOWSKI Sławomir Stanisław
602
14.45
2.70
16
ZASADZKI Włodzimierz Andrzej
32
0.76
0.14
17
ADAMSKI Euzebiusz Sylwester
25
0.60
0.11
18
KOPEĆ Maciej Stanisław
89
2.13
0.40
19
TEREBECKI Bogdan
24
0.57
0.11
20
KIELIBA Leokadia Grażyna
14
0.33
0.06
21
WOJCIECHOWSKA Bożena
70
1.68
0.31
22
MAGDA Jan
23
0.55
0.10
23
STĘPIEŃ Stanisław
169
4.05
0.76
24
BRZOZOWSKI Andrzej
198
4.75
0.89
25
SROKA Zbigniew Kazimierz
28
0.67
0.13
26
KOPACKA Marzena Teresa
104
2.49
0.47
Σ
4166
100.00
18.68
.
.
Voting Results by location of ward electoral commission.
.
.
.
.
.
.
.
.
.
.
.
.
.
.
.
.
.
No.
Name
No. of entitled
to vote
No. of ballot
papers issued
No. of votes
No. of votes: per list / valid [%]
total
valid
per List
1
City
27095
13848
13807
13432
2578
19.19
2
Country
21855
9157
9155
8869
1588
17.91
.
Voting Results by number of inhabitants of commune
.
1
to 5 000
9154
4326
4325
4191
779
18.59
2
from 5 001 to 10 000
7305
3088
3064
2976
629
21.14
3
from 10 001 to 20 000
13245
5902
5891
5642
1097
19.44
4
from 20 001 to 50 000
19246
9689
9682
9492
1661
17.50
5
from 50 001 to 100 000
0
0
0
0
0
0.00
6
from 100 001 to 200 000
0
0
0
0
0
0.00
7
from 200 001 to 500 000
0
0
0
0
0
0.00
8
over 500 000
0
0
0
0
0
0.00
Legal Acts
Documents
Electoral Bodies
Election Committees and Candidates
Turnout
Results
Statistical Data
SENATE
Created by
Copyright © 2007
Mikrobit Sp. z o.o.
. All Rights Reserved.
top