.
.
Legal Acts
Documents
Electoral Bodies
Election Committees and Candidates
Turnout
Results
Statistical Data
SENATE
Created by
.
.
Voting Results
.
.
.
Voting Results for Committee
.
.
.
.
.
.
.
.
.
.
.
.
.
.
.
.
.
.
.
.
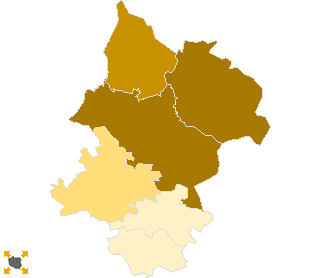
Polska
/
Kielce
/
włoszczowski, pow.
...
Komitet Wyborczy Prawo i Sprawiedliwość
List's Number:
6
No. of valid votes:
16686
No. of votes per List:
8306
49.78%
lack
27.00%
29.93%
32.86%
35.79%
38.72%
41.65%
44.58%
47.51%
50.44%
53.37%
not
of data
29.92%
32.85%
35.78%
38.71%
41.64%
44.57%
47.50%
50.43%
53.36%
56.30%
applicable
See also:
Turnout
Votes per Lists
Votes per Candidates
Information about Election Committee
Election results
Voting Results by location of ward electoral commission
.
.
Voting Results for Committee.
.
.
.
.
.
.
.
.
.
.
.
.
.
.
.
.
.
No.
Name
No. of entitled
to vote
No. of ballot papers
issued
No. of votes
No. of votes: per list / valid [%]
total
valid
per List
261301
Kluczewsko, gm.
4135
1842
1842
1768
921
52.09
261302
Krasocin, gm.
8417
3669
3667
3565
2005
56.24
261303
Moskorzew, gm.
2435
1201
1201
1150
323
28.09
261304
Radków, gm.
2202
743
743
722
195
27.01
261305
Secemin, gm.
4176
1541
1541
1491
573
38.43
261306
Włoszczowa, gm.
16471
8244
8226
7990
4289
53.68
włoszczowski, pow.
37836
17240
17220
16686
8306
49.78
.
.
Voting Results for Candidates
.
.
.
.
.
.
.
.
.
.
.
.
.
.
.
No.
Surname Names
No. of votes
% No. of votes per candidate/No. per list
% No. of votes per candidate/No. of valid votes
1
GOSIEWSKI Przemysław Edgar
5861
70.56
35.13
2
OLENDZKA Halina Bronisława
42
0.50
0.25
3
ZUBA Maria
30
0.36
0.18
4
RUSIECKI Jarosław
7
0.08
0.04
5
LIPIEC Krzysztof Bogdan
26
0.31
0.16
6
BOGUSŁAWSKI Marek Paweł
26
0.31
0.16
7
BĘTKOWSKI Andrzej Krzysztof
24
0.28
0.14
8
SKIBIŃSKI Janusz Bolesław
15
0.18
0.09
9
KWITEK Marek
8
0.09
0.05
10
CEPIL Józef
21
0.25
0.13
11
GRZĄDZIEL Andrzej
10
0.12
0.06
12
PRZYGODZKI Jarosław Artur
5
0.06
0.03
13
SŁOŃ Krzysztof
7
0.08
0.04
14
BATÓG Stanisław
3
0.03
0.02
15
ZAWIERUCHA-RUBAK Alfreda
8
0.09
0.05
16
ŁAGANOWSKI Łukasz
5
0.06
0.03
17
MISZCZYK Jarosław
3
0.03
0.02
18
GĘBSKI Mieczysław
13
0.15
0.08
19
SZPARA Robert
5
0.06
0.03
20
KARST Krzysztof
15
0.18
0.09
21
LIPIŃSKI Piotr Paweł
1
0.01
0.01
22
TOMBARKIEWICZ Marek Janusz
2
0.02
0.01
23
WIJAS Stanisław Wojciech
28
0.33
0.17
24
PARADOWSKI Jerzy Jan
4
0.04
0.02
25
RYCOMBEL Czesław
0
0.00
0.00
26
LIGOWSKI Krzysztof Kazimierz
3
0.03
0.02
27
PAŁKA Rafał Hubert
135
1.62
0.81
28
WRONA Waldemar Krzysztof
3
0.03
0.02
29
PODSIADŁO Adam Piotr
3
0.03
0.02
30
PĘKALA Zbigniew Wacław
1
0.01
0.01
31
PRZEMYSKI Alojzy
3
0.03
0.02
32
DORYWALSKI Bartłomiej
1989
23.94
11.92
Σ
8306
100.00
49.77
.
.
Voting Results by location of ward electoral commission.
.
.
.
.
.
.
.
.
.
.
.
.
.
.
.
.
.
No.
Name
No. of entitled
to vote
No. of ballot
papers issued
No. of votes
No. of votes: per list / valid [%]
total
valid
per List
1
City
8882
4932
4929
4826
2667
55.26
2
Country
28954
12308
12291
11860
5639
47.55
.
Voting Results by number of inhabitants of commune
.
1
to 5 000
4637
1944
1944
1872
518
27.67
2
from 5 001 to 10 000
8311
3383
3383
3259
1494
45.84
3
from 10 001 to 20 000
8417
3669
3667
3565
2005
56.24
4
from 20 001 to 50 000
16471
8244
8226
7990
4289
53.68
5
from 50 001 to 100 000
0
0
0
0
0
0.00
6
from 100 001 to 200 000
0
0
0
0
0
0.00
7
from 200 001 to 500 000
0
0
0
0
0
0.00
8
over 500 000
0
0
0
0
0
0.00
Legal Acts
Documents
Electoral Bodies
Election Committees and Candidates
Turnout
Results
Statistical Data
SENATE
Created by
Copyright © 2007
Mikrobit Sp. z o.o.
. All Rights Reserved.
top