.
.
Legal Acts
Documents
Electoral Bodies
Election Committees and Candidates
Turnout
Results
Statistical Data
SENATE
Created by
.
.
Voting Results
.
.
.
Voting Results for Committee
.
.
.
.
.
.
.
.
.
.
.
.
.
.
.
.
.
.
.
.
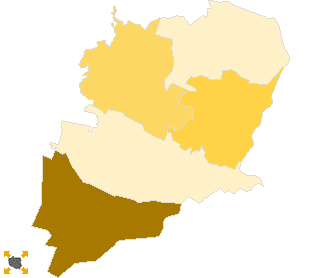
Polska
/
Katowice
/
bieruńsko-lędziński, pow.
...
Komitet Wyborczy Prawo i Sprawiedliwość
List's Number:
6
No. of valid votes:
24031
No. of votes per List:
11306
47.05%
lack
42.85%
44.22%
45.59%
46.96%
48.33%
49.70%
51.07%
52.44%
53.81%
55.18%
not
of data
44.21%
45.58%
46.95%
48.32%
49.69%
51.06%
52.43%
53.80%
55.17%
56.55%
applicable
See also:
Turnout
Votes per Lists
Votes per Candidates
Information about Election Committee
Election results
Voting Results by location of ward electoral commission
.
.
Voting Results for Committee.
.
.
.
.
.
.
.
.
.
.
.
.
.
.
.
.
.
No.
Name
No. of entitled
to vote
No. of ballot papers
issued
No. of votes
No. of votes: per list / valid [%]
total
valid
per List
241401
Bieruń, m.
15615
8615
8609
8356
3581
42.86
241404
Bojszowy, gm.
5195
3230
3230
3162
1787
56.51
241405
Chełm Śląski, gm.
4555
2520
2520
2466
1237
50.16
241402
Imielin, m.
6288
3684
3682
3611
1551
42.95
241403
Lędziny, m.
12582
6587
6585
6436
3150
48.94
bieruńsko-lędziński, pow.
44235
24636
24626
24031
11306
47.05
.
.
Voting Results for Candidates
.
.
.
.
.
.
.
.
.
.
.
.
.
.
.
No.
Surname Names
No. of votes
% No. of votes per candidate/No. per list
% No. of votes per candidate/No. of valid votes
1
POLACZEK Jerzy Jan
5007
44.28
20.84
2
SOŚNIERZ Andrzej Stanisław
1621
14.33
6.75
3
NOWAK Maria Teresa
465
4.11
1.94
4
MIKUŁA Krzysztof Józef
132
1.16
0.55
5
TOBISZOWSKI Grzegorz Józef
115
1.01
0.48
6
PIETRASZ Piotr Aleksander
69
0.61
0.29
7
FIERLA Damian Tomasz
133
1.17
0.55
8
MYNARSKI Marek Franciszek
52
0.45
0.22
9
SOBCZYK Danuta Elżbieta
197
1.74
0.82
10
PARUZEL Henryk Józef
1426
12.61
5.93
11
GROBELKA Marek Jacek
34
0.30
0.14
12
DROB Henryk Marek
819
7.24
3.41
13
KUCHARSKI Janusz Tadeusz
185
1.63
0.77
14
KACZYŃSKI Leonard Zbigniew
439
3.88
1.83
15
MICHNA Klaudiusz Tomasz
41
0.36
0.17
16
PIEROŃCZYK Marcin Tomasz
50
0.44
0.21
17
KORUS Arkadiusz Paweł
40
0.35
0.17
18
SKIBA Mariusz Piotr
90
0.79
0.37
19
WŁODARCZYK Adam Jacek
57
0.50
0.24
20
BRUSZEWSKA - DUBIEL Irena Maria
60
0.53
0.25
21
ZAJKOWSKI Józef
20
0.17
0.08
22
BUBAŁA Marek Piotr
22
0.19
0.09
23
GAWLIKOWSKI Witold
30
0.26
0.12
24
JACENT Daniel Andrzej
202
1.78
0.84
Σ
11306
100.00
47.04
.
.
Voting Results by location of ward electoral commission.
.
.
.
.
.
.
.
.
.
.
.
.
.
.
.
.
.
No.
Name
No. of entitled
to vote
No. of ballot
papers issued
No. of votes
No. of votes: per list / valid [%]
total
valid
per List
1
City
34485
18886
18876
18403
8282
45.00
2
Country
9750
5750
5750
5628
3024
53.73
.
Voting Results by number of inhabitants of commune
.
1
to 5 000
0
0
0
0
0
0.00
2
from 5 001 to 10 000
16038
9434
9432
9239
4575
49.52
3
from 10 001 to 20 000
28197
15202
15194
14792
6731
45.50
4
from 20 001 to 50 000
0
0
0
0
0
0.00
5
from 50 001 to 100 000
0
0
0
0
0
0.00
6
from 100 001 to 200 000
0
0
0
0
0
0.00
7
from 200 001 to 500 000
0
0
0
0
0
0.00
8
over 500 000
0
0
0
0
0
0.00
Legal Acts
Documents
Electoral Bodies
Election Committees and Candidates
Turnout
Results
Statistical Data
SENATE
Created by
Copyright © 2007
Mikrobit Sp. z o.o.
. All Rights Reserved.
top