.
.
Legal Acts
Documents
Electoral Bodies
Election Committees and Candidates
Turnout
Results
Statistical Data
SENATE
Created by
.
.
Voting Results
.
.
.
Voting Results for Committee
.
.
.
.
.
.
.
.
.
.
.
.
.
.
.
.
.
.
.
.
Polska
/
Gdańsk
/
malborski, pow.
...
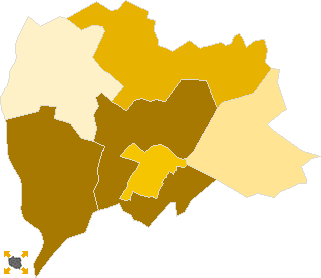
Komitet Wyborczy Prawo i Sprawiedliwość
List's Number:
6
No. of valid votes:
24842
No. of votes per List:
5717
23.01%
lack
17.75%
18.55%
19.35%
20.15%
20.95%
21.75%
22.55%
23.35%
24.15%
24.95%
not
of data
18.54%
19.34%
20.14%
20.94%
21.74%
22.54%
23.34%
24.14%
24.94%
25.75%
applicable
See also:
Turnout
Votes per Lists
Votes per Candidates
Information about Election Committee
Election results
Voting Results by location of ward electoral commission
.
.
Voting Results for Committee.
.
.
.
.
.
.
.
.
.
.
.
.
.
.
.
.
.
No.
Name
No. of entitled
to vote
No. of ballot papers
issued
No. of votes
No. of votes: per list / valid [%]
total
valid
per List
220903
Lichnowy, gm.
3495
1463
1462
1408
250
17.76
220904
Malbork, gm.
3182
1290
1289
1252
322
25.72
220901
Malbork, m.
31345
17186
17169
16904
3926
23.23
220906
Miłoradz, gm.
2663
1073
1071
1041
265
25.46
220907
Nowy Staw, gm.
6135
2691
2688
2590
623
24.05
220908
Stare Pole, gm.
3593
1679
1678
1647
331
20.10
malborski, pow.
50413
25382
25357
24842
5717
23.01
.
.
Voting Results for Candidates
.
.
.
.
.
.
.
.
.
.
.
.
.
.
.
No.
Surname Names
No. of votes
% No. of votes per candidate/No. per list
% No. of votes per candidate/No. of valid votes
1
PŁAŻYŃSKI Maciej
1574
27.53
6.34
2
KURSKI Jacek Olgierd
593
10.37
2.39
3
CYMAŃSKI Tadeusz
2762
48.31
11.12
4
LISS Andrzej Marcelin
46
0.80
0.19
5
CHRAPKIEWICZ Daniela Jadwiga
21
0.36
0.08
6
ŻEBROWSKI Arwid Marek
35
0.61
0.14
7
JANKOWSKA Aleksandra Helena
28
0.48
0.11
8
GWIAZDA Anna Teresa
80
1.39
0.32
9
ARCISZEWSKI Zbigniew Krzysztof
12
0.20
0.05
10
NOWAK Czesław
33
0.57
0.13
11
WIŚNIEWSKI Edward Maciej
207
3.62
0.83
12
SIKORA Danuta Teresa
77
1.34
0.31
13
SMOLIŃSKI Kazimierz
51
0.89
0.21
14
KORALEWSKI Kazimierz Marian
5
0.08
0.02
15
KAMIŃSKI Wiesław
17
0.29
0.07
16
JAGODA-MADALIŃSKA Maria Bronisława
19
0.33
0.08
17
RUTKOWSKI Romuald Bogusław
16
0.27
0.06
18
PACZKOWSKI Bohdan
15
0.26
0.06
19
WITOS Sławomir Jerzy
4
0.06
0.02
20
KRYDA Marek Andrzej
30
0.52
0.12
21
KONASZEWSKI Jarosław
5
0.08
0.02
22
KASZTELAN Sebastian Piotr
10
0.17
0.04
23
ROSANI Magdalena
17
0.29
0.07
24
JAWORSKI Andrzej
60
1.04
0.24
Σ
5717
100.00
23.01
.
.
Voting Results by location of ward electoral commission.
.
.
.
.
.
.
.
.
.
.
.
.
.
.
.
.
.
No.
Name
No. of entitled
to vote
No. of ballot
papers issued
No. of votes
No. of votes: per list / valid [%]
total
valid
per List
1
City
36422
19517
19497
19154
4480
23.39
2
Country
13991
5865
5860
5688
1237
21.75
.
Voting Results by number of inhabitants of commune
.
1
to 5 000
12933
5505
5500
5348
1168
21.84
2
from 5 001 to 10 000
6135
2691
2688
2590
623
24.05
3
from 10 001 to 20 000
0
0
0
0
0
0.00
4
from 20 001 to 50 000
31345
17186
17169
16904
3926
23.23
5
from 50 001 to 100 000
0
0
0
0
0
0.00
6
from 100 001 to 200 000
0
0
0
0
0
0.00
7
from 200 001 to 500 000
0
0
0
0
0
0.00
8
over 500 000
0
0
0
0
0
0.00
Legal Acts
Documents
Electoral Bodies
Election Committees and Candidates
Turnout
Results
Statistical Data
SENATE
Created by
Copyright © 2007
Mikrobit Sp. z o.o.
. All Rights Reserved.
top