.
.
Legal Acts
Documents
Electoral Bodies
Election Committees and Candidates
Turnout
Results
Statistical Data
SENATE
Created by
.
.
Voting Results
.
.
.
Voting Results for Committee
.
.
.
.
.
.
.
.
.
.
.
.
.
.
.
.
.
.
.
.
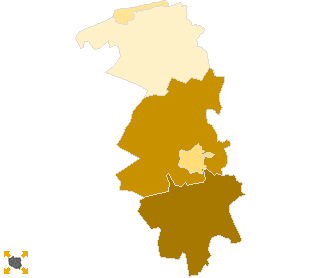
Polska
/
Gdynia
/
lęborski, pow.
...
Komitet Wyborczy Prawo i Sprawiedliwość
List's Number:
6
No. of valid votes:
25040
No. of votes per List:
5979
23.88%
lack
19.71%
20.56%
21.41%
22.26%
23.11%
23.96%
24.81%
25.66%
26.51%
27.36%
not
of data
20.55%
21.40%
22.25%
23.10%
23.95%
24.80%
25.65%
26.50%
27.35%
28.21%
applicable
See also:
Turnout
Votes per Lists
Votes per Candidates
Information about Election Committee
Election results
Voting Results by location of ward electoral commission
.
.
Voting Results for Committee.
.
.
.
.
.
.
.
.
.
.
.
.
.
.
.
.
.
No.
Name
No. of entitled
to vote
No. of ballot papers
issued
No. of votes
No. of votes: per list / valid [%]
total
valid
per List
220803
Cewice, gm.
5165
2458
2458
2398
675
28.15
220801
Lębork, m.
27703
15283
15257
15005
3463
23.08
220802
Łeba, m.
3243
1778
1778
1733
381
21.98
220804
Nowa Wieś Lęborska, gm.
9352
4427
4421
4286
1141
26.62
220805
Wicko, gm.
4240
1663
1663
1618
319
19.72
lęborski, pow.
49703
25609
25577
25040
5979
23.88
.
.
Voting Results for Candidates
.
.
.
.
.
.
.
.
.
.
.
.
.
.
.
No.
Surname Names
No. of votes
% No. of votes per candidate/No. per list
% No. of votes per candidate/No. of valid votes
1
SZCZYPIŃSKA Jolanta Irena
3068
51.31
12.25
2
SELLIN Jarosław Daniel
278
4.64
1.11
3
KOZAK Zbigniew Ryszard
122
2.04
0.49
4
KARCZEWSKI Piotr Mariusz
247
4.13
0.99
5
GASZTA Grzegorz Marek
26
0.43
0.10
6
STANKE Piotr Jerzy
58
0.97
0.23
7
MIELEWCZYK Wiesław
692
11.57
2.76
8
HAŁUBEK Grzegorz Piotr
45
0.75
0.18
9
JURCZYK Krzysztof Marcin
49
0.81
0.20
10
ŚLIWICKI Adam Wojciech
100
1.67
0.40
11
PĘK Tadeusz Szymon
689
11.52
2.75
12
LEWENSTAM Wojciech Kazimierz
14
0.23
0.06
13
DENIS Andrzej Radosław
34
0.56
0.14
14
ŁUCZYK Mariusz Wojciech
28
0.46
0.11
15
BONKOWSKI Waldemar
59
0.98
0.24
16
RECLAF Witold Grzegorz
31
0.51
0.12
17
DOLNY Andrzej
24
0.40
0.10
18
PLESZYNIAK Andrzej
16
0.26
0.06
19
KASPRZYK Genowefa
41
0.68
0.16
20
JUREK Stanisław
33
0.55
0.13
21
ŁOŚ Stanisława Aldona
58
0.97
0.23
22
TREDER Adam
51
0.85
0.20
23
KAŹMIERCZAK Andrzej Stanisław
25
0.41
0.10
24
BIERAWSKI Bogumił Jerzy
12
0.20
0.05
25
CZARNECKI Ryszard Teodor
34
0.56
0.14
26
ŚLEDZIŃSKA Grażyna Emilia
40
0.66
0.16
27
DETTLAFF Zbigniew Marian
31
0.51
0.12
28
WICZKOWSKI Janusz Piotr
74
1.23
0.30
Σ
5979
100.00
23.87
.
.
Voting Results by location of ward electoral commission.
.
.
.
.
.
.
.
.
.
.
.
.
.
.
.
.
.
No.
Name
No. of entitled
to vote
No. of ballot
papers issued
No. of votes
No. of votes: per list / valid [%]
total
valid
per List
1
City
30946
17061
17035
16738
3844
22.97
2
Country
18757
8548
8542
8302
2135
25.72
.
Voting Results by number of inhabitants of commune
.
1
to 5 000
3243
1778
1778
1733
381
21.98
2
from 5 001 to 10 000
9405
4121
4121
4016
994
24.75
3
from 10 001 to 20 000
9352
4427
4421
4286
1141
26.62
4
from 20 001 to 50 000
27703
15283
15257
15005
3463
23.08
5
from 50 001 to 100 000
0
0
0
0
0
0.00
6
from 100 001 to 200 000
0
0
0
0
0
0.00
7
from 200 001 to 500 000
0
0
0
0
0
0.00
8
over 500 000
0
0
0
0
0
0.00
Legal Acts
Documents
Electoral Bodies
Election Committees and Candidates
Turnout
Results
Statistical Data
SENATE
Created by
Copyright © 2007
Mikrobit Sp. z o.o.
. All Rights Reserved.
top