.
.
Legal Acts
Documents
Electoral Bodies
Election Committees and Candidates
Turnout
Results
Statistical Data
SENATE
Created by
.
.
Voting Results
.
.
.
Voting Results for Committee
.
.
.
.
.
.
.
.
.
.
.
.
.
.
.
.
.
.
.
.
Polska
/
Gdynia
/
kościerski, pow.
...
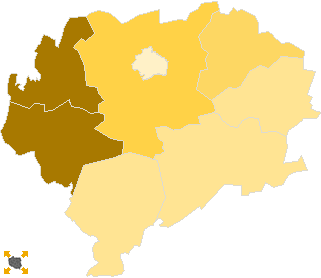
Komitet Wyborczy Prawo i Sprawiedliwość
List's Number:
6
No. of valid votes:
26745
No. of votes per List:
9081
33.95%
lack
28.90%
30.54%
32.18%
33.82%
35.46%
37.10%
38.74%
40.38%
42.02%
43.66%
not
of data
30.53%
32.17%
33.81%
35.45%
37.09%
38.73%
40.37%
42.01%
43.65%
45.30%
applicable
See also:
Turnout
Votes per Lists
Votes per Candidates
Information about Election Committee
Election results
Voting Results by location of ward electoral commission
.
.
Voting Results for Committee.
.
.
.
.
.
.
.
.
.
.
.
.
.
.
.
.
.
No.
Name
No. of entitled
to vote
No. of ballot papers
issued
No. of votes
No. of votes: per list / valid [%]
total
valid
per List
220602
Dziemiany, gm.
3065
1640
1639
1586
718
45.27
220603
Karsin, gm.
4439
2448
2446
2338
770
32.93
220604
Kościerzyna, gm.
10203
5347
5329
5159
1930
37.41
220601
Kościerzyna, m.
18282
10493
10485
10238
2959
28.90
220605
Liniewo, gm.
3542
1775
1775
1726
570
33.02
220606
Lipusz, gm.
2516
1421
1421
1386
623
44.95
220607
Nowa Karczma, gm.
4681
2178
2178
2118
779
36.78
220608
Stara Kiszewa, gm.
4904
2261
2261
2194
732
33.36
kościerski, pow.
51632
27563
27534
26745
9081
33.95
.
.
Voting Results for Candidates
.
.
.
.
.
.
.
.
.
.
.
.
.
.
.
No.
Surname Names
No. of votes
% No. of votes per candidate/No. per list
% No. of votes per candidate/No. of valid votes
1
SZCZYPIŃSKA Jolanta Irena
2044
22.50
7.64
2
SELLIN Jarosław Daniel
328
3.61
1.23
3
KOZAK Zbigniew Ryszard
111
1.22
0.42
4
KARCZEWSKI Piotr Mariusz
3238
35.65
12.11
5
GASZTA Grzegorz Marek
52
0.57
0.19
6
STANKE Piotr Jerzy
254
2.79
0.95
7
MIELEWCZYK Wiesław
180
1.98
0.67
8
HAŁUBEK Grzegorz Piotr
84
0.92
0.31
9
JURCZYK Krzysztof Marcin
136
1.49
0.51
10
ŚLIWICKI Adam Wojciech
100
1.10
0.37
11
PĘK Tadeusz Szymon
81
0.89
0.30
12
LEWENSTAM Wojciech Kazimierz
27
0.29
0.10
13
DENIS Andrzej Radosław
75
0.82
0.28
14
ŁUCZYK Mariusz Wojciech
28
0.30
0.10
15
BONKOWSKI Waldemar
1487
16.37
5.56
16
RECLAF Witold Grzegorz
52
0.57
0.19
17
DOLNY Andrzej
70
0.77
0.26
18
PLESZYNIAK Andrzej
24
0.26
0.09
19
KASPRZYK Genowefa
44
0.48
0.16
20
JUREK Stanisław
46
0.50
0.17
21
ŁOŚ Stanisława Aldona
253
2.78
0.95
22
TREDER Adam
77
0.84
0.29
23
KAŹMIERCZAK Andrzej Stanisław
45
0.49
0.17
24
BIERAWSKI Bogumił Jerzy
30
0.33
0.11
25
CZARNECKI Ryszard Teodor
42
0.46
0.16
26
ŚLEDZIŃSKA Grażyna Emilia
37
0.40
0.14
27
DETTLAFF Zbigniew Marian
58
0.63
0.22
28
WICZKOWSKI Janusz Piotr
78
0.85
0.29
Σ
9081
100.00
33.95
.
.
Voting Results by location of ward electoral commission.
.
.
.
.
.
.
.
.
.
.
.
.
.
.
.
.
.
No.
Name
No. of entitled
to vote
No. of ballot
papers issued
No. of votes
No. of votes: per list / valid [%]
total
valid
per List
1
City
18282
10493
10485
10238
2959
28.90
2
Country
33350
17070
17049
16507
6122
37.09
.
Voting Results by number of inhabitants of commune
.
1
to 5 000
9123
4836
4835
4698
1911
40.68
2
from 5 001 to 10 000
14024
6887
6885
6650
2281
34.30
3
from 10 001 to 20 000
10203
5347
5329
5159
1930
37.41
4
from 20 001 to 50 000
18282
10493
10485
10238
2959
28.90
5
from 50 001 to 100 000
0
0
0
0
0
0.00
6
from 100 001 to 200 000
0
0
0
0
0
0.00
7
from 200 001 to 500 000
0
0
0
0
0
0.00
8
over 500 000
0
0
0
0
0
0.00
Legal Acts
Documents
Electoral Bodies
Election Committees and Candidates
Turnout
Results
Statistical Data
SENATE
Created by
Copyright © 2007
Mikrobit Sp. z o.o.
. All Rights Reserved.
top