.
.
Legal Acts
Documents
Electoral Bodies
Election Committees and Candidates
Turnout
Results
Statistical Data
SENATE
Created by
.
.
Voting Results
.
.
.
Voting Results for Committee
.
.
.
.
.
.
.
.
.
.
.
.
.
.
.
.
.
.
.
.
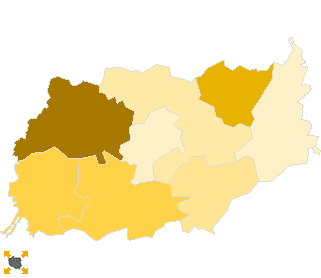
Polska
/
Gdynia
/
kartuski, pow.
...
Komitet Wyborczy Prawo i Sprawiedliwość
List's Number:
6
No. of valid votes:
44914
No. of votes per List:
16355
36.41%
lack
30.73%
32.38%
34.03%
35.68%
37.33%
38.98%
40.63%
42.28%
43.93%
45.58%
not
of data
32.37%
34.02%
35.67%
37.32%
38.97%
40.62%
42.27%
43.92%
45.57%
47.23%
applicable
See also:
Turnout
Votes per Lists
Votes per Candidates
Information about Election Committee
Election results
Voting Results by location of ward electoral commission
.
.
Voting Results for Committee.
.
.
.
.
.
.
.
.
.
.
.
.
.
.
.
.
.
No.
Name
No. of entitled
to vote
No. of ballot papers
issued
No. of votes
No. of votes: per list / valid [%]
total
valid
per List
220501
Chmielno, gm.
4783
2716
2716
2652
815
30.73
220502
Kartuzy, gm.
23485
13809
13795
13531
4480
33.11
220503
Przodkowo, gm.
5022
2740
2727
2647
1146
43.29
220504
Sierakowice, gm.
11835
6904
6903
6721
3172
47.20
220505
Somonino, gm.
6648
3338
3338
3212
1111
34.59
220506
Stężyca, gm.
6401
3528
3527
3434
1381
40.22
220507
Sulęczyno, gm.
3601
2049
2049
1955
771
39.44
220508
Żukowo, gm.
18518
11022
11015
10762
3479
32.33
kartuski, pow.
80293
46106
46070
44914
16355
36.41
.
.
Voting Results for Candidates
.
.
.
.
.
.
.
.
.
.
.
.
.
.
.
No.
Surname Names
No. of votes
% No. of votes per candidate/No. per list
% No. of votes per candidate/No. of valid votes
1
SZCZYPIŃSKA Jolanta Irena
5339
32.64
11.89
2
SELLIN Jarosław Daniel
2181
13.33
4.86
3
KOZAK Zbigniew Ryszard
458
2.80
1.02
4
KARCZEWSKI Piotr Mariusz
1686
10.30
3.75
5
GASZTA Grzegorz Marek
136
0.83
0.30
6
STANKE Piotr Jerzy
297
1.81
0.66
7
MIELEWCZYK Wiesław
820
5.01
1.83
8
HAŁUBEK Grzegorz Piotr
129
0.78
0.29
9
JURCZYK Krzysztof Marcin
213
1.30
0.47
10
ŚLIWICKI Adam Wojciech
275
1.68
0.61
11
PĘK Tadeusz Szymon
268
1.63
0.60
12
LEWENSTAM Wojciech Kazimierz
95
0.58
0.21
13
DENIS Andrzej Radosław
242
1.47
0.54
14
ŁUCZYK Mariusz Wojciech
97
0.59
0.22
15
BONKOWSKI Waldemar
912
5.57
2.03
16
RECLAF Witold Grzegorz
361
2.20
0.80
17
DOLNY Andrzej
108
0.66
0.24
18
PLESZYNIAK Andrzej
327
1.99
0.73
19
KASPRZYK Genowefa
114
0.69
0.25
20
JUREK Stanisław
140
0.85
0.31
21
ŁOŚ Stanisława Aldona
866
5.29
1.93
22
TREDER Adam
216
1.32
0.48
23
KAŹMIERCZAK Andrzej Stanisław
112
0.68
0.25
24
BIERAWSKI Bogumił Jerzy
322
1.96
0.72
25
CZARNECKI Ryszard Teodor
167
1.02
0.37
26
ŚLEDZIŃSKA Grażyna Emilia
135
0.82
0.30
27
DETTLAFF Zbigniew Marian
61
0.37
0.14
28
WICZKOWSKI Janusz Piotr
278
1.69
0.62
Σ
16355
100.00
36.41
.
.
Voting Results by location of ward electoral commission.
.
.
.
.
.
.
.
.
.
.
.
.
.
.
.
.
.
No.
Name
No. of entitled
to vote
No. of ballot
papers issued
No. of votes
No. of votes: per list / valid [%]
total
valid
per List
1
City
17536
10988
10974
10811
3223
29.81
2
Country
62757
35118
35096
34103
13132
38.51
.
Voting Results by number of inhabitants of commune
.
1
to 5 000
3601
2049
2049
1955
771
39.44
2
from 5 001 to 10 000
22854
12322
12308
11945
4453
37.28
3
from 10 001 to 20 000
11835
6904
6903
6721
3172
47.20
4
from 20 001 to 50 000
42003
24831
24810
24293
7959
32.76
5
from 50 001 to 100 000
0
0
0
0
0
0.00
6
from 100 001 to 200 000
0
0
0
0
0
0.00
7
from 200 001 to 500 000
0
0
0
0
0
0.00
8
over 500 000
0
0
0
0
0
0.00
Legal Acts
Documents
Electoral Bodies
Election Committees and Candidates
Turnout
Results
Statistical Data
SENATE
Created by
Copyright © 2007
Mikrobit Sp. z o.o.
. All Rights Reserved.
top