.
.
Legal Acts
Documents
Electoral Bodies
Election Committees and Candidates
Turnout
Results
Statistical Data
SENATE
Created by
.
.
Voting Results
.
.
.
Voting Results for Committee
.
.
.
.
.
.
.
.
.
.
.
.
.
.
.
.
.
.
.
.
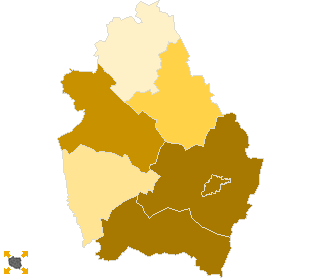
Polska
/
Gdynia
/
człuchowski, pow.
...
Komitet Wyborczy Prawo i Sprawiedliwość
List's Number:
6
No. of valid votes:
21002
No. of votes per List:
3459
16.47%
lack
12.72%
13.25%
13.78%
14.31%
14.84%
15.37%
15.90%
16.43%
16.96%
17.49%
not
of data
13.24%
13.77%
14.30%
14.83%
15.36%
15.89%
16.42%
16.95%
17.48%
18.02%
applicable
See also:
Turnout
Votes per Lists
Votes per Candidates
Information about Election Committee
Election results
Voting Results by location of ward electoral commission
.
.
Voting Results for Committee.
.
.
.
.
.
.
.
.
.
.
.
.
.
.
.
.
.
No.
Name
No. of entitled
to vote
No. of ballot papers
issued
No. of votes
No. of votes: per list / valid [%]
total
valid
per List
220302
Czarne, gm.
8841
4476
4476
4292
610
14.21
220303
Człuchów, gm.
7595
3072
3070
2962
520
17.56
220301
Człuchów, m.
11932
6592
6592
6392
1148
17.96
220304
Debrzno, gm.
7177
2964
2964
2837
497
17.52
220305
Koczała, gm.
2860
1322
1322
1242
158
12.72
220306
Przechlewo, gm.
4791
2280
2279
2183
336
15.39
220307
Rzeczenica, gm.
2937
1153
1153
1094
190
17.37
człuchowski, pow.
46133
21859
21856
21002
3459
16.47
.
.
Voting Results for Candidates
.
.
.
.
.
.
.
.
.
.
.
.
.
.
.
No.
Surname Names
No. of votes
% No. of votes per candidate/No. per list
% No. of votes per candidate/No. of valid votes
1
SZCZYPIŃSKA Jolanta Irena
1624
46.94
7.73
2
SELLIN Jarosław Daniel
100
2.89
0.48
3
KOZAK Zbigniew Ryszard
65
1.87
0.31
4
KARCZEWSKI Piotr Mariusz
109
3.15
0.52
5
GASZTA Grzegorz Marek
19
0.54
0.09
6
STANKE Piotr Jerzy
464
13.41
2.21
7
MIELEWCZYK Wiesław
81
2.34
0.39
8
HAŁUBEK Grzegorz Piotr
28
0.80
0.13
9
JURCZYK Krzysztof Marcin
52
1.50
0.25
10
ŚLIWICKI Adam Wojciech
27
0.78
0.13
11
PĘK Tadeusz Szymon
51
1.47
0.24
12
LEWENSTAM Wojciech Kazimierz
15
0.43
0.07
13
DENIS Andrzej Radosław
26
0.75
0.12
14
ŁUCZYK Mariusz Wojciech
28
0.80
0.13
15
BONKOWSKI Waldemar
30
0.86
0.14
16
RECLAF Witold Grzegorz
14
0.40
0.07
17
DOLNY Andrzej
35
1.01
0.17
18
PLESZYNIAK Andrzej
5
0.14
0.02
19
KASPRZYK Genowefa
32
0.92
0.15
20
JUREK Stanisław
284
8.21
1.35
21
ŁOŚ Stanisława Aldona
56
1.61
0.27
22
TREDER Adam
10
0.28
0.05
23
KAŹMIERCZAK Andrzej Stanisław
32
0.92
0.15
24
BIERAWSKI Bogumił Jerzy
10
0.28
0.05
25
CZARNECKI Ryszard Teodor
53
1.53
0.25
26
ŚLEDZIŃSKA Grażyna Emilia
166
4.79
0.79
27
DETTLAFF Zbigniew Marian
7
0.20
0.03
28
WICZKOWSKI Janusz Piotr
36
1.04
0.17
Σ
3459
100.00
16.46
.
.
Voting Results by location of ward electoral commission.
.
.
.
.
.
.
.
.
.
.
.
.
.
.
.
.
.
No.
Name
No. of entitled
to vote
No. of ballot
papers issued
No. of votes
No. of votes: per list / valid [%]
total
valid
per List
1
City
22205
11989
11989
11609
1883
16.22
2
Country
23928
9870
9867
9393
1576
16.78
.
Voting Results by number of inhabitants of commune
.
1
to 5 000
5797
2475
2475
2336
348
14.90
2
from 5 001 to 10 000
20809
9720
9719
9312
1443
15.50
3
from 10 001 to 20 000
19527
9664
9662
9354
1668
17.83
4
from 20 001 to 50 000
0
0
0
0
0
0.00
5
from 50 001 to 100 000
0
0
0
0
0
0.00
6
from 100 001 to 200 000
0
0
0
0
0
0.00
7
from 200 001 to 500 000
0
0
0
0
0
0.00
8
over 500 000
0
0
0
0
0
0.00
Legal Acts
Documents
Electoral Bodies
Election Committees and Candidates
Turnout
Results
Statistical Data
SENATE
Created by
Copyright © 2007
Mikrobit Sp. z o.o.
. All Rights Reserved.
top