.
.
Legal Acts
Documents
Electoral Bodies
Election Committees and Candidates
Turnout
Results
Statistical Data
SENATE
Created by
.
.
Voting Results
.
.
.
Voting Results for Committee
.
.
.
.
.
.
.
.
.
.
.
.
.
.
.
.
.
.
.
.
Polska
/
Białystok
/
kolneński, pow.
...
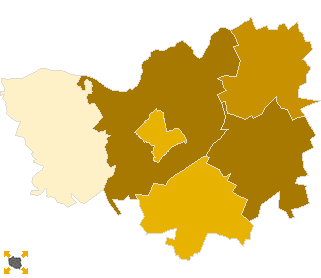
Komitet Wyborczy Prawo i Sprawiedliwość
List's Number:
6
No. of valid votes:
12481
No. of votes per List:
5519
44.22%
lack
31.51%
33.25%
34.99%
36.73%
38.47%
40.21%
41.95%
43.69%
45.43%
47.17%
not
of data
33.24%
34.98%
36.72%
38.46%
40.20%
41.94%
43.68%
45.42%
47.16%
48.91%
applicable
See also:
Turnout
Votes per Lists
Votes per Candidates
Information about Election Committee
Election results
Voting Results by location of ward electoral commission
.
.
Voting Results for Committee.
.
.
.
.
.
.
.
.
.
.
.
.
.
.
.
.
.
No.
Name
No. of entitled
to vote
No. of ballot papers
issued
No. of votes
No. of votes: per list / valid [%]
total
valid
per List
200602
Grabowo, gm.
2917
1249
1249
1205
554
45.98
200603
Kolno, gm.
6739
2759
2759
2669
1278
47.88
200601
Kolno, m.
8670
3747
3747
3641
1616
44.38
200604
Mały Płock, gm.
3990
1504
1504
1454
640
44.02
200605
Stawiski, gm.
5255
1931
1931
1865
912
48.90
200606
Turośl, gm.
3830
1701
1701
1647
519
31.51
kolneński, pow.
31401
12891
12891
12481
5519
44.22
.
.
Voting Results for Candidates
.
.
.
.
.
.
.
.
.
.
.
.
.
.
.
No.
Surname Names
No. of votes
% No. of votes per candidate/No. per list
% No. of votes per candidate/No. of valid votes
1
PUTRA Krzysztof Jakub
1071
19.40
8.58
2
JURGIEL Krzysztof
379
6.86
3.04
3
ZIELIŃSKI Jarosław
309
5.59
2.48
4
KOŁAKOWSKI Lech Antoni
707
12.81
5.66
5
BOGUCKI Jacek
209
3.78
1.67
6
GWIAZDOWSKI Kazimierz
914
16.56
7.32
7
KAMIŃSKI Mariusz
320
5.79
2.56
8
TOŁWIŃSKI Krzysztof
74
1.34
0.59
9
KOMOROWSKI Marek Adam
98
1.77
0.79
10
CHEŁMIŃSKI Grzegorz Dariusz
24
0.43
0.19
11
CHARYTON Roch Andrzej
6
0.10
0.05
12
DEMBOWSKI Zbigniew
22
0.39
0.18
13
ZAJK Mieczysław
968
17.53
7.76
14
SOWA Adam Krzysztof
154
2.79
1.23
15
ŁABĘDZKI Bogusław Szczepan
11
0.19
0.09
16
DĄBROWSKA-SZMULIK Barbara
30
0.54
0.24
17
OSMOLSKI Andrzej
5
0.09
0.04
18
RABCZYŃSKA Elżbieta
31
0.56
0.25
19
BOBIN Irena
16
0.28
0.13
20
JAWOROWSKI Henryk
17
0.30
0.14
21
ANDRUSZKIEWICZ Krzysztof Zygmunt
9
0.16
0.07
22
GIEŁCZYŃSKI Bartosz
6
0.10
0.05
23
ŁUNIEWSKI Artur
3
0.05
0.02
24
KONCEREWICZ Piotr Tadeusz
7
0.12
0.06
25
CEMPA Sławomir Stanisław
16
0.28
0.13
26
KONOPKO Mirosław Krzysztof
43
0.77
0.34
27
JANKOWSKI Krzysztof
14
0.25
0.11
28
GRYKO Jarosław
12
0.21
0.10
29
ŻERO Czesław
21
0.38
0.17
30
MACKO Wiesław
23
0.41
0.18
Σ
5519
100.00
44.21
.
.
Voting Results by location of ward electoral commission.
.
.
.
.
.
.
.
.
.
.
.
.
.
.
.
.
.
No.
Name
No. of entitled
to vote
No. of ballot
papers issued
No. of votes
No. of votes: per list / valid [%]
total
valid
per List
1
City
11616
4893
4893
4746
2169
45.70
2
Country
19785
7998
7998
7735
3350
43.31
.
Voting Results by number of inhabitants of commune
.
1
to 5 000
2917
1249
1249
1205
554
45.98
2
from 5 001 to 10 000
19814
7895
7895
7635
3349
43.86
3
from 10 001 to 20 000
8670
3747
3747
3641
1616
44.38
4
from 20 001 to 50 000
0
0
0
0
0
0.00
5
from 50 001 to 100 000
0
0
0
0
0
0.00
6
from 100 001 to 200 000
0
0
0
0
0
0.00
7
from 200 001 to 500 000
0
0
0
0
0
0.00
8
over 500 000
0
0
0
0
0
0.00
Legal Acts
Documents
Electoral Bodies
Election Committees and Candidates
Turnout
Results
Statistical Data
SENATE
Created by
Copyright © 2007
Mikrobit Sp. z o.o.
. All Rights Reserved.
top