.
.
Legal Acts
Documents
Electoral Bodies
Election Committees and Candidates
Turnout
Results
Statistical Data
SENATE
Created by
.
.
Voting Results
.
.
.
Voting Results for Committee
.
.
.
.
.
.
.
.
.
.
.
.
.
.
.
.
.
.
.
.
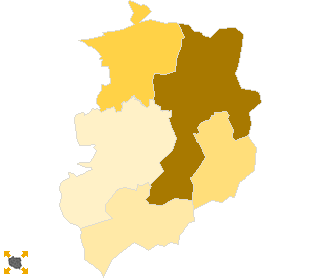
Polska
/
Rzeszów
/
ropczycko-sędziszowski, pow.
...
Komitet Wyborczy Prawo i Sprawiedliwość
List's Number:
6
No. of valid votes:
27695
No. of votes per List:
15968
57.66%
lack
52.73%
53.85%
54.97%
56.09%
57.21%
58.33%
59.45%
60.57%
61.69%
62.81%
not
of data
53.84%
54.96%
56.08%
57.20%
58.32%
59.44%
60.56%
61.68%
62.80%
63.93%
applicable
See also:
Turnout
Votes per Lists
Votes per Candidates
Information about Election Committee
Election results
Voting Results by location of ward electoral commission
.
.
Voting Results for Committee.
.
.
.
.
.
.
.
.
.
.
.
.
.
.
.
.
.
No.
Name
No. of entitled
to vote
No. of ballot papers
issued
No. of votes
No. of votes: per list / valid [%]
total
valid
per List
181501
Iwierzyce, gm.
5643
2996
2996
2920
1653
56.61
181502
Ostrów, gm.
5218
2224
2224
2146
1274
59.37
181503
Ropczyce, gm.
20160
10553
10550
10327
5446
52.74
181504
Sędziszów Małopolski, gm.
17631
9698
9697
9492
6060
63.84
181505
Wielopole Skrzyńskie, gm.
6340
2894
2891
2810
1535
54.63
ropczycko-sędziszowski, pow.
54992
28365
28358
27695
15968
57.66
.
.
Voting Results for Candidates
.
.
.
.
.
.
.
.
.
.
.
.
.
.
.
No.
Surname Names
No. of votes
% No. of votes per candidate/No. per list
% No. of votes per candidate/No. of valid votes
1
GĘSICKA Grażyna
935
5.85
3.38
2
OŻÓG Stanisław
980
6.13
3.54
3
PAKUŁA-SACHARCZUK Anna Zofia
228
1.42
0.82
4
SZLACHTA Andrzej
632
3.95
2.28
5
CHMIELOWIEC Zbigniew Michał
234
1.46
0.84
6
MOSKAL Kazimierz Marian
9195
57.58
33.20
7
GOŁOJUCH Kazimierz Edward
64
0.40
0.23
8
FRĄCZEK Małgorzata Helena
131
0.82
0.47
9
WARZECHA Jan Marek
75
0.46
0.27
10
WÓJTOWICZ Andrzej
136
0.85
0.49
11
POPIOŁEK Krzysztof Andrzej
45
0.28
0.16
12
GODEK Robert Czesław
113
0.70
0.41
13
KIDA Jan
42
0.26
0.15
14
CYPRYŚ Jerzy
177
1.10
0.64
15
KULTYS Robert
25
0.15
0.09
16
KAMIŃSKI Tadeusz
232
1.45
0.84
17
WYSKIEL Józef Stanisław
25
0.15
0.09
18
KMIEĆ Bogusław
2419
15.14
8.73
19
TRZUSKOT Eugeniusz
12
0.07
0.04
20
KAPICA Andrzej
19
0.11
0.07
21
BARTNIK Marian Antoni
18
0.11
0.06
22
GARDY Paweł Bronisław
2
0.01
0.01
23
TOMCZYK Elżbieta Maria
37
0.23
0.13
24
HADŁAW Adam
4
0.02
0.01
25
KOGUT Marek
40
0.25
0.14
26
DĄBEK Mirosław Stanisław
21
0.13
0.08
27
DRĄG Wiesław Zbigniew
30
0.18
0.11
28
SASAK Jerzy
9
0.05
0.03
29
RZEPKA Jerzy Jan
30
0.18
0.11
30
BŁĄDEK Antoni
58
0.36
0.21
Σ
15968
100.00
57.65
.
.
Voting Results by location of ward electoral commission.
.
.
.
.
.
.
.
.
.
.
.
.
.
.
.
.
.
No.
Name
No. of entitled
to vote
No. of ballot
papers issued
No. of votes
No. of votes: per list / valid [%]
total
valid
per List
1
City
17798
10113
10111
9921
4858
48.97
2
Country
37194
18252
18247
17774
11110
62.51
.
Voting Results by number of inhabitants of commune
.
1
to 5 000
0
0
0
0
0
0.00
2
from 5 001 to 10 000
17201
8114
8111
7876
4462
56.65
3
from 10 001 to 20 000
0
0
0
0
0
0.00
4
from 20 001 to 50 000
37791
20251
20247
19819
11506
58.06
5
from 50 001 to 100 000
0
0
0
0
0
0.00
6
from 100 001 to 200 000
0
0
0
0
0
0.00
7
from 200 001 to 500 000
0
0
0
0
0
0.00
8
over 500 000
0
0
0
0
0
0.00
Legal Acts
Documents
Electoral Bodies
Election Committees and Candidates
Turnout
Results
Statistical Data
SENATE
Created by
Copyright © 2007
Mikrobit Sp. z o.o.
. All Rights Reserved.
top