.
.
Legal Acts
Documents
Electoral Bodies
Election Committees and Candidates
Turnout
Results
Statistical Data
SENATE
Created by
.
.
Voting Results
.
.
.
Voting Results for Committee
.
.
.
.
.
.
.
.
.
.
.
.
.
.
.
.
.
.
.
.
Polska
/
Rzeszów
/
kolbuszowski, pow.
...
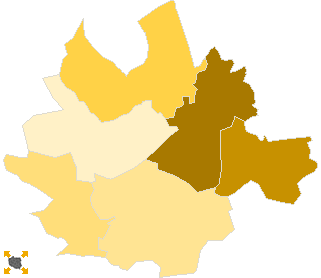
Komitet Wyborczy Prawo i Sprawiedliwość
List's Number:
6
No. of valid votes:
22133
No. of votes per List:
14117
63.78%
lack
59.92%
60.87%
61.82%
62.77%
63.72%
64.67%
65.62%
66.57%
67.52%
68.47%
not
of data
60.86%
61.81%
62.76%
63.71%
64.66%
65.61%
66.56%
67.51%
68.46%
69.42%
applicable
See also:
Turnout
Votes per Lists
Votes per Candidates
Information about Election Committee
Election results
Voting Results by location of ward electoral commission
.
.
Voting Results for Committee.
.
.
.
.
.
.
.
.
.
.
.
.
.
.
.
.
.
No.
Name
No. of entitled
to vote
No. of ballot papers
issued
No. of votes
No. of votes: per list / valid [%]
total
valid
per List
180601
Cmolas, gm.
5977
2867
2867
2780
1666
59.93
180606
Dzikowiec, gm.
4968
2058
2058
1987
1378
69.35
180602
Kolbuszowa, gm.
19355
9763
9762
9539
5939
62.26
180603
Majdan Królewski, gm.
7478
3426
3422
3364
2204
65.52
180604
Niwiska, gm.
4412
1986
1986
1934
1216
62.87
180605
Raniżów, gm.
5450
2621
2620
2529
1714
67.77
kolbuszowski, pow.
47640
22721
22715
22133
14117
63.78
.
.
Voting Results for Candidates
.
.
.
.
.
.
.
.
.
.
.
.
.
.
.
No.
Surname Names
No. of votes
% No. of votes per candidate/No. per list
% No. of votes per candidate/No. of valid votes
1
GĘSICKA Grażyna
505
3.57
2.28
2
OŻÓG Stanisław
492
3.48
2.22
3
PAKUŁA-SACHARCZUK Anna Zofia
85
0.60
0.38
4
SZLACHTA Andrzej
123
0.87
0.56
5
CHMIELOWIEC Zbigniew Michał
11890
84.22
53.72
6
MOSKAL Kazimierz Marian
156
1.10
0.70
7
GOŁOJUCH Kazimierz Edward
29
0.20
0.13
8
FRĄCZEK Małgorzata Helena
111
0.78
0.50
9
WARZECHA Jan Marek
34
0.24
0.15
10
WÓJTOWICZ Andrzej
224
1.58
1.01
11
POPIOŁEK Krzysztof Andrzej
52
0.36
0.23
12
GODEK Robert Czesław
54
0.38
0.24
13
KIDA Jan
19
0.13
0.09
14
CYPRYŚ Jerzy
43
0.30
0.19
15
KULTYS Robert
13
0.09
0.06
16
KAMIŃSKI Tadeusz
76
0.53
0.34
17
WYSKIEL Józef Stanisław
13
0.09
0.06
18
KMIEĆ Bogusław
24
0.17
0.11
19
TRZUSKOT Eugeniusz
7
0.04
0.03
20
KAPICA Andrzej
12
0.08
0.05
21
BARTNIK Marian Antoni
8
0.05
0.04
22
GARDY Paweł Bronisław
5
0.03
0.02
23
TOMCZYK Elżbieta Maria
39
0.27
0.18
24
HADŁAW Adam
3
0.02
0.01
25
KOGUT Marek
31
0.21
0.14
26
DĄBEK Mirosław Stanisław
26
0.18
0.12
27
DRĄG Wiesław Zbigniew
5
0.03
0.02
28
SASAK Jerzy
3
0.02
0.01
29
RZEPKA Jerzy Jan
11
0.07
0.05
30
BŁĄDEK Antoni
24
0.17
0.11
Σ
14117
100.00
63.78
.
.
Voting Results by location of ward electoral commission.
.
.
.
.
.
.
.
.
.
.
.
.
.
.
.
.
.
No.
Name
No. of entitled
to vote
No. of ballot
papers issued
No. of votes
No. of votes: per list / valid [%]
total
valid
per List
1
City
7645
3965
3964
3887
2023
52.05
2
Country
39995
18756
18751
18246
12094
66.28
.
Voting Results by number of inhabitants of commune
.
1
to 5 000
0
0
0
0
0
0.00
2
from 5 001 to 10 000
20807
9532
9531
9230
5974
64.72
3
from 10 001 to 20 000
7478
3426
3422
3364
2204
65.52
4
from 20 001 to 50 000
19355
9763
9762
9539
5939
62.26
5
from 50 001 to 100 000
0
0
0
0
0
0.00
6
from 100 001 to 200 000
0
0
0
0
0
0.00
7
from 200 001 to 500 000
0
0
0
0
0
0.00
8
over 500 000
0
0
0
0
0
0.00
Legal Acts
Documents
Electoral Bodies
Election Committees and Candidates
Turnout
Results
Statistical Data
SENATE
Created by
Copyright © 2007
Mikrobit Sp. z o.o.
. All Rights Reserved.
top