.
.
Legal Acts
Documents
Electoral Bodies
Election Committees and Candidates
Turnout
Results
Statistical Data
SENATE
Created by
.
.
Voting Results
.
.
.
Voting Results for Committee
.
.
.
.
.
.
.
.
.
.
.
.
.
.
.
.
.
.
.
.
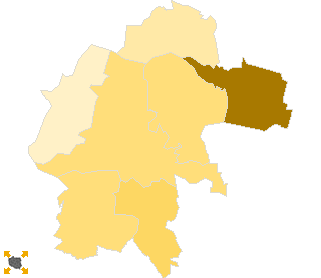
Polska
/
Opole
/
strzelecki, pow.
...
Komitet Wyborczy Prawo i Sprawiedliwość
List's Number:
6
No. of valid votes:
24676
No. of votes per List:
4237
17.17%
lack
10.53%
12.05%
13.57%
15.09%
16.61%
18.13%
19.65%
21.17%
22.69%
24.21%
not
of data
12.04%
13.56%
15.08%
16.60%
18.12%
19.64%
21.16%
22.68%
24.20%
25.73%
applicable
See also:
Turnout
Votes per Lists
Votes per Candidates
Information about Election Committee
Election results
Voting Results by location of ward electoral commission
.
.
Voting Results for Committee.
.
.
.
.
.
.
.
.
.
.
.
.
.
.
.
.
.
No.
Name
No. of entitled
to vote
No. of ballot papers
issued
No. of votes
No. of votes: per list / valid [%]
total
valid
per List
161101
Izbicko, gm.
4367
1631
1631
1575
166
10.54
161102
Jemielnica, gm.
5863
1944
1943
1858
286
15.39
161103
Kolonowskie, gm.
5183
1808
1808
1694
205
12.10
161104
Leśnica, gm.
6716
2535
2535
2454
403
16.42
161105
Strzelce Opolskie, gm.
28015
11929
11926
11533
1902
16.49
161106
Ujazd, gm.
5016
2000
2000
1917
340
17.74
161107
Zawadzkie, gm.
10371
3757
3759
3645
935
25.65
strzelecki, pow.
65531
25604
25602
24676
4237
17.17
.
.
Voting Results for Candidates
.
.
.
.
.
.
.
.
.
.
.
.
.
.
.
No.
Surname Names
No. of votes
% No. of votes per candidate/No. per list
% No. of votes per candidate/No. of valid votes
1
DĄBKOWSKA-CICHOCKA Lena
886
20.91
3.59
2
KŁOSOWSKI Sławomir
736
17.37
2.98
3
WALKIEWICZ Mieczysław
103
2.43
0.42
4
CEGLECKA-ZIELONKA Teresa Zuzanna
163
3.84
0.66
5
CZERWIŃSKI Jerzy
146
3.44
0.59
6
OSTROWSKI Jarosław Krzysztof
143
3.37
0.58
7
MADERA Dariusz Piotr
160
3.77
0.65
8
PANCZEŚNIK Piotr
41
0.96
0.17
9
BORTNIK Wacław
46
1.08
0.19
10
MEDOLIŃSKI Dariusz Stanisław
20
0.47
0.08
11
BEDNARSKI Michał
64
1.51
0.26
12
SAWICKI Grzegorz Adam
69
1.62
0.28
13
RELIGA Jan Andrzej
834
19.68
3.38
14
GRABOWIECKI Dariusz Grzegorz
46
1.08
0.19
15
DAROWSKI Leszek Piotr
24
0.56
0.10
16
BYCZKOWSKI Dariusz Paweł
13
0.30
0.05
17
PICH Józef
65
1.53
0.26
18
SADŁOWSKI Adam Paweł
18
0.42
0.07
19
KOLBEK Dariusz Stanisław
18
0.42
0.07
20
SZCZEPAŃSKI Jacek Wiktor
30
0.70
0.12
21
WRÓBEL Henryk Zdzisław
143
3.37
0.58
22
SZYMAŃSKI Arkadiusz
50
1.18
0.20
23
NIEDŹWIEDŹ Mieczysław
34
0.80
0.14
24
POSPISZYL Piotr
330
7.78
1.34
25
ZWIERZYŃSKI Marek Wojciech
10
0.23
0.04
26
MARTYNISZYN Adam Stanisław
45
1.06
0.18
Σ
4237
100.00
17.17
.
.
Voting Results by location of ward electoral commission.
.
.
.
.
.
.
.
.
.
.
.
.
.
.
.
.
.
No.
Name
No. of entitled
to vote
No. of ballot
papers issued
No. of votes
No. of votes: per list / valid [%]
total
valid
per List
1
City
31019
13724
13723
13275
2361
17.79
2
Country
34512
11880
11879
11401
1876
16.45
.
Voting Results by number of inhabitants of commune
.
1
to 5 000
0
0
0
0
0
0.00
2
from 5 001 to 10 000
27145
9918
9917
9498
1400
14.74
3
from 10 001 to 20 000
10371
3757
3759
3645
935
25.65
4
from 20 001 to 50 000
28015
11929
11926
11533
1902
16.49
5
from 50 001 to 100 000
0
0
0
0
0
0.00
6
from 100 001 to 200 000
0
0
0
0
0
0.00
7
from 200 001 to 500 000
0
0
0
0
0
0.00
8
over 500 000
0
0
0
0
0
0.00
Legal Acts
Documents
Electoral Bodies
Election Committees and Candidates
Turnout
Results
Statistical Data
SENATE
Created by
Copyright © 2007
Mikrobit Sp. z o.o.
. All Rights Reserved.
top