.
.
Legal Acts
Documents
Electoral Bodies
Election Committees and Candidates
Turnout
Results
Statistical Data
SENATE
Created by
.
.
Voting Results
.
.
.
Voting Results for Committee
.
.
.
.
.
.
.
.
.
.
.
.
.
.
.
.
.
.
.
.
Polska
/
Opole
/
oleski, pow.
...
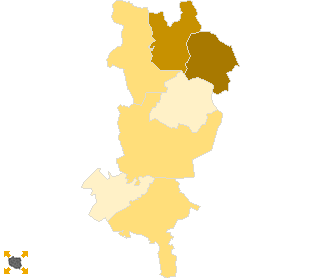
Komitet Wyborczy Prawo i Sprawiedliwość
List's Number:
6
No. of valid votes:
21208
No. of votes per List:
4356
20.54%
lack
10.00%
12.06%
14.12%
16.18%
18.24%
20.30%
22.36%
24.42%
26.48%
28.54%
not
of data
12.05%
14.11%
16.17%
18.23%
20.29%
22.35%
24.41%
26.47%
28.53%
30.60%
applicable
See also:
Turnout
Votes per Lists
Votes per Candidates
Information about Election Committee
Election results
Voting Results by location of ward electoral commission
.
.
Voting Results for Committee.
.
.
.
.
.
.
.
.
.
.
.
.
.
.
.
.
.
No.
Name
No. of entitled
to vote
No. of ballot papers
issued
No. of votes
No. of votes: per list / valid [%]
total
valid
per List
160801
Dobrodzień, gm.
8352
2755
2754
2666
441
16.54
160802
Gorzów Śląski, gm.
6078
2151
2151
2090
368
17.61
160803
Olesno, gm.
14985
6188
6187
6039
1000
16.56
160804
Praszka, gm.
11636
5686
5681
5553
1471
26.49
160805
Radłów, gm.
3575
1038
1038
1006
108
10.74
160806
Rudniki, gm.
6829
2918
2918
2835
866
30.55
160807
Zębowice, gm.
3205
1057
1057
1019
102
10.01
oleski, pow.
54660
21793
21786
21208
4356
20.54
.
.
Voting Results for Candidates
.
.
.
.
.
.
.
.
.
.
.
.
.
.
.
No.
Surname Names
No. of votes
% No. of votes per candidate/No. per list
% No. of votes per candidate/No. of valid votes
1
DĄBKOWSKA-CICHOCKA Lena
1076
24.70
5.07
2
KŁOSOWSKI Sławomir
805
18.48
3.80
3
WALKIEWICZ Mieczysław
104
2.38
0.49
4
CEGLECKA-ZIELONKA Teresa Zuzanna
258
5.92
1.22
5
CZERWIŃSKI Jerzy
116
2.66
0.55
6
OSTROWSKI Jarosław Krzysztof
140
3.21
0.66
7
MADERA Dariusz Piotr
134
3.07
0.63
8
PANCZEŚNIK Piotr
43
0.98
0.20
9
BORTNIK Wacław
126
2.89
0.59
10
MEDOLIŃSKI Dariusz Stanisław
40
0.91
0.19
11
BEDNARSKI Michał
122
2.80
0.58
12
SAWICKI Grzegorz Adam
141
3.23
0.66
13
RELIGA Jan Andrzej
768
17.63
3.62
14
GRABOWIECKI Dariusz Grzegorz
32
0.73
0.15
15
DAROWSKI Leszek Piotr
26
0.59
0.12
16
BYCZKOWSKI Dariusz Paweł
22
0.50
0.10
17
PICH Józef
61
1.40
0.29
18
SADŁOWSKI Adam Paweł
18
0.41
0.08
19
KOLBEK Dariusz Stanisław
12
0.27
0.06
20
SZCZEPAŃSKI Jacek Wiktor
37
0.84
0.17
21
WRÓBEL Henryk Zdzisław
67
1.53
0.32
22
SZYMAŃSKI Arkadiusz
53
1.21
0.25
23
NIEDŹWIEDŹ Mieczysław
26
0.59
0.12
24
POSPISZYL Piotr
13
0.29
0.06
25
ZWIERZYŃSKI Marek Wojciech
18
0.41
0.08
26
MARTYNISZYN Adam Stanisław
98
2.24
0.46
Σ
4356
100.00
20.53
.
.
Voting Results by location of ward electoral commission.
.
.
.
.
.
.
.
.
.
.
.
.
.
.
.
.
.
No.
Name
No. of entitled
to vote
No. of ballot
papers issued
No. of votes
No. of votes: per list / valid [%]
total
valid
per List
1
City
21457
10079
10078
9849
1948
19.78
2
Country
33203
11714
11708
11359
2408
21.20
.
Voting Results by number of inhabitants of commune
.
1
to 5 000
6780
2095
2095
2025
210
10.37
2
from 5 001 to 10 000
12907
5069
5069
4925
1234
25.06
3
from 10 001 to 20 000
34973
14629
14622
14258
2912
20.42
4
from 20 001 to 50 000
0
0
0
0
0
0.00
5
from 50 001 to 100 000
0
0
0
0
0
0.00
6
from 100 001 to 200 000
0
0
0
0
0
0.00
7
from 200 001 to 500 000
0
0
0
0
0
0.00
8
over 500 000
0
0
0
0
0
0.00
Legal Acts
Documents
Electoral Bodies
Election Committees and Candidates
Turnout
Results
Statistical Data
SENATE
Created by
Copyright © 2007
Mikrobit Sp. z o.o.
. All Rights Reserved.
top