.
.
Legal Acts
Documents
Electoral Bodies
Election Committees and Candidates
Turnout
Results
Statistical Data
SENATE
Created by
.
.
Voting Results
.
.
.
Voting Results for Committee
.
.
.
.
.
.
.
.
.
.
.
.
.
.
.
.
.
.
.
.
Polska
/
Opole
/
brzeski, pow.
...
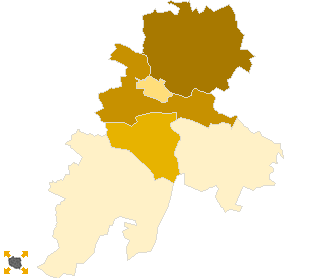
Komitet Wyborczy Prawo i Sprawiedliwość
List's Number:
6
No. of valid votes:
35112
No. of votes per List:
11044
31.45%
lack
27.28%
28.47%
29.66%
30.85%
32.04%
33.23%
34.42%
35.61%
36.80%
37.99%
not
of data
28.46%
29.65%
30.84%
32.03%
33.22%
34.41%
35.60%
36.79%
37.98%
39.18%
applicable
See also:
Turnout
Votes per Lists
Votes per Candidates
Information about Election Committee
Election results
Voting Results by location of ward electoral commission
.
.
Voting Results for Committee.
.
.
.
.
.
.
.
.
.
.
.
.
.
.
.
.
.
No.
Name
No. of entitled
to vote
No. of ballot papers
issued
No. of votes
No. of votes: per list / valid [%]
total
valid
per List
160101
Brzeg, m.
31103
16737
16732
16502
5192
31.46
160103
Grodków, gm.
15705
6734
6734
6566
1801
27.43
160104
Lewin Brzeski, gm.
10462
4831
4828
4688
1279
27.28
160105
Lubsza, gm.
6979
3060
3060
2946
1152
39.10
160106
Olszanka, gm.
3886
1869
1869
1831
660
36.05
160102
Skarbimierz, gm.
5318
2655
2655
2579
960
37.22
brzeski, pow.
73453
35886
35878
35112
11044
31.45
.
.
Voting Results for Candidates
.
.
.
.
.
.
.
.
.
.
.
.
.
.
.
No.
Surname Names
No. of votes
% No. of votes per candidate/No. per list
% No. of votes per candidate/No. of valid votes
1
DĄBKOWSKA-CICHOCKA Lena
2388
21.62
6.80
2
KŁOSOWSKI Sławomir
950
8.60
2.71
3
WALKIEWICZ Mieczysław
232
2.10
0.66
4
CEGLECKA-ZIELONKA Teresa Zuzanna
367
3.32
1.05
5
CZERWIŃSKI Jerzy
443
4.01
1.26
6
OSTROWSKI Jarosław Krzysztof
570
5.16
1.62
7
MADERA Dariusz Piotr
211
1.91
0.60
8
PANCZEŚNIK Piotr
60
0.54
0.17
9
BORTNIK Wacław
204
1.84
0.58
10
MEDOLIŃSKI Dariusz Stanisław
81
0.73
0.23
11
BEDNARSKI Michał
163
1.47
0.46
12
SAWICKI Grzegorz Adam
318
2.87
0.91
13
RELIGA Jan Andrzej
1021
9.24
2.91
14
GRABOWIECKI Dariusz Grzegorz
129
1.16
0.37
15
DAROWSKI Leszek Piotr
53
0.47
0.15
16
BYCZKOWSKI Dariusz Paweł
2935
26.57
8.36
17
PICH Józef
138
1.24
0.39
18
SADŁOWSKI Adam Paweł
24
0.21
0.07
19
KOLBEK Dariusz Stanisław
24
0.21
0.07
20
SZCZEPAŃSKI Jacek Wiktor
51
0.46
0.15
21
WRÓBEL Henryk Zdzisław
112
1.01
0.32
22
SZYMAŃSKI Arkadiusz
65
0.58
0.19
23
NIEDŹWIEDŹ Mieczysław
165
1.49
0.47
24
POSPISZYL Piotr
21
0.19
0.06
25
ZWIERZYŃSKI Marek Wojciech
145
1.31
0.41
26
MARTYNISZYN Adam Stanisław
174
1.57
0.50
Σ
11044
100.00
31.45
.
.
Voting Results by location of ward electoral commission.
.
.
.
.
.
.
.
.
.
.
.
.
.
.
.
.
.
No.
Name
No. of entitled
to vote
No. of ballot
papers issued
No. of votes
No. of votes: per list / valid [%]
total
valid
per List
1
City
44581
23457
23450
23085
6916
29.96
2
Country
28872
12429
12428
12027
4128
34.32
.
Voting Results by number of inhabitants of commune
.
1
to 5 000
3886
1869
1869
1831
660
36.05
2
from 5 001 to 10 000
12297
5715
5715
5525
2112
38.23
3
from 10 001 to 20 000
26167
11565
11562
11254
3080
27.37
4
from 20 001 to 50 000
31103
16737
16732
16502
5192
31.46
5
from 50 001 to 100 000
0
0
0
0
0
0.00
6
from 100 001 to 200 000
0
0
0
0
0
0.00
7
from 200 001 to 500 000
0
0
0
0
0
0.00
8
over 500 000
0
0
0
0
0
0.00
Legal Acts
Documents
Electoral Bodies
Election Committees and Candidates
Turnout
Results
Statistical Data
SENATE
Created by
Copyright © 2007
Mikrobit Sp. z o.o.
. All Rights Reserved.
top