.
.
Legal Acts
Documents
Electoral Bodies
Election Committees and Candidates
Turnout
Results
Statistical Data
SENATE
Created by
.
.
Voting Results
.
.
.
Voting Results for Committee
.
.
.
.
.
.
.
.
.
.
.
.
.
.
.
.
.
.
.
.
Polska
/
Kraków
/
olkuski, pow.
...
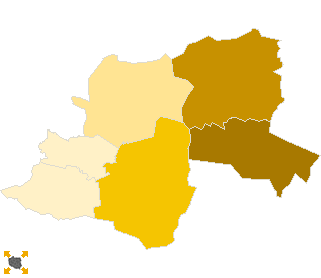
Komitet Wyborczy Prawo i Sprawiedliwość
List's Number:
6
No. of valid votes:
47835
No. of votes per List:
17787
37.18%
lack
28.28%
29.97%
31.66%
33.35%
35.04%
36.73%
38.42%
40.11%
41.80%
43.49%
not
of data
29.96%
31.65%
33.34%
35.03%
36.72%
38.41%
40.10%
41.79%
43.48%
45.18%
applicable
See also:
Turnout
Votes per Lists
Votes per Candidates
Information about Election Committee
Election results
Voting Results by location of ward electoral commission
.
.
Voting Results for Committee.
.
.
.
.
.
.
.
.
.
.
.
.
.
.
.
.
.
No.
Name
No. of entitled
to vote
No. of ballot papers
issued
No. of votes
No. of votes: per list / valid [%]
total
valid
per List
121203
Bolesław, gm.
6354
3062
3061
2984
844
28.28
121201
Bukowno, m.
8737
4441
4441
4370
1287
29.45
121204
Klucze, gm.
12254
6504
6500
6339
2026
31.96
121205
Olkusz, gm.
41635
23642
23623
23225
8971
38.63
121206
Trzyciąż, gm.
5667
2208
2208
2142
966
45.10
121207
Wolbrom, gm.
18713
8986
8982
8775
3693
42.09
olkuski, pow.
93360
48843
48815
47835
17787
37.18
.
.
Voting Results for Candidates
.
.
.
.
.
.
.
.
.
.
.
.
.
.
.
No.
Surname Names
No. of votes
% No. of votes per candidate/No. per list
% No. of votes per candidate/No. of valid votes
1
ZIOBRO Zbigniew
12952
72.81
27.08
2
WASSERMANN Zbigniew Franciszek
430
2.41
0.90
3
TERLECKI Ryszard
160
0.89
0.33
4
ADAMCZYK Andrzej
304
1.70
0.64
5
RYNIAK Monika Anna
68
0.38
0.14
6
GILARSKI Mirosław Jan
71
0.39
0.15
7
ROSTECKI Rafał Klaudiusz
22
0.12
0.05
8
KOSIOR Bolesław Henryk
25
0.14
0.05
9
PILCH Józef Adam
70
0.39
0.15
10
FLAGA Stanisław Jerzy
32
0.17
0.07
11
BATOR Jakub
14
0.07
0.03
12
OWCZARSKI Zbysław Piotr
530
2.97
1.11
13
ROSTWOROWSKI Józef
68
0.38
0.14
14
PIETRUS Włodzimierz Wacław
29
0.16
0.06
15
RACHWAŁ Stanisław
24
0.13
0.05
16
ZAMORSKA Grażyna Małgorzata
48
0.26
0.10
17
JURCZAK Marian
30
0.16
0.06
18
MAJERCZAK Stefan Juliusz
8
0.04
0.02
19
ŚCISŁOWICZ Zbigniew
11
0.06
0.02
20
GORAJ Lucjan
113
0.63
0.24
21
WIATROWSKI Piotr
18
0.10
0.04
22
GOLENIA Zdzisław Stanisław
6
0.03
0.01
23
LISIAK Ireneusz Teofil
18
0.10
0.04
24
BANYŚ Bogusław Bronisław
295
1.65
0.62
25
OSUCH Jacek Piotr
2341
13.16
4.89
26
TATARA Agata Iwona
100
0.56
0.21
Σ
17787
100.00
37.18
.
.
Voting Results by location of ward electoral commission.
.
.
.
.
.
.
.
.
.
.
.
.
.
.
.
.
.
No.
Name
No. of entitled
to vote
No. of ballot
papers issued
No. of votes
No. of votes: per list / valid [%]
total
valid
per List
1
City
47416
26646
26624
26222
8875
33.85
2
Country
45944
22197
22191
21613
8912
41.23
.
Voting Results by number of inhabitants of commune
.
1
to 5 000
0
0
0
0
0
0.00
2
from 5 001 to 10 000
12021
5270
5269
5126
1810
35.31
3
from 10 001 to 20 000
20991
10945
10941
10709
3313
30.94
4
from 20 001 to 50 000
18713
8986
8982
8775
3693
42.09
5
from 50 001 to 100 000
41635
23642
23623
23225
8971
38.63
6
from 100 001 to 200 000
0
0
0
0
0
0.00
7
from 200 001 to 500 000
0
0
0
0
0
0.00
8
over 500 000
0
0
0
0
0
0.00
Legal Acts
Documents
Electoral Bodies
Election Committees and Candidates
Turnout
Results
Statistical Data
SENATE
Created by
Copyright © 2007
Mikrobit Sp. z o.o.
. All Rights Reserved.
top