.
.
Legal Acts
Documents
Electoral Bodies
Election Committees and Candidates
Turnout
Results
Statistical Data
SENATE
Created by
.
.
Voting Results
.
.
.
Voting Results for Committee
.
.
.
.
.
.
.
.
.
.
.
.
.
.
.
.
.
.
.
.
Polska
/
Lublin
/
świdnicki, pow.
...
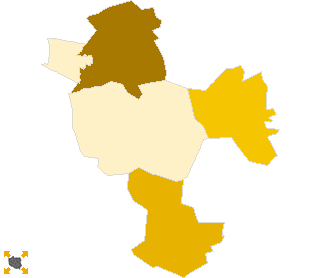
Komitet Wyborczy Prawo i Sprawiedliwość
List's Number:
6
No. of valid votes:
29554
No. of votes per List:
12404
41.97%
lack
40.25%
41.12%
41.99%
42.86%
43.73%
44.60%
45.47%
46.34%
47.21%
48.08%
not
of data
41.11%
41.98%
42.85%
43.72%
44.59%
45.46%
46.33%
47.20%
48.07%
48.95%
applicable
See also:
Turnout
Votes per Lists
Votes per Candidates
Information about Election Committee
Election results
Voting Results by location of ward electoral commission
.
.
Voting Results for Committee.
.
.
.
.
.
.
.
.
.
.
.
.
.
.
.
.
.
No.
Name
No. of entitled
to vote
No. of ballot papers
issued
No. of votes
No. of votes: per list / valid [%]
total
valid
per List
061702
Mełgiew, gm.
6453
2982
2981
2945
1439
48.86
061703
Piaski, gm.
8618
3751
3742
3657
1472
40.25
061704
Rybczewice, gm.
3229
1315
1315
1283
597
46.53
061701
Świdnik, m.
33322
19278
19258
19068
7696
40.36
061705
Trawniki, gm.
7333
2691
2690
2601
1200
46.14
świdnicki, pow.
58955
30017
29986
29554
12404
41.97
.
.
Voting Results for Candidates
.
.
.
.
.
.
.
.
.
.
.
.
.
.
.
No.
Surname Names
No. of votes
% No. of votes per candidate/No. per list
% No. of votes per candidate/No. of valid votes
1
KRUK Elżbieta Małgorzata
4778
38.51
16.17
2
MICHAŁKIEWICZ Krzysztof Stefan
827
6.66
2.80
3
SADURSKA Małgorzata Barbara
1019
8.21
3.45
4
ŻACZEK Jarosław
369
2.97
1.25
5
MASŁOWSKA Gabriela
856
6.90
2.90
6
PODKAŃSKI Krzysztof Piotr
786
6.33
2.66
7
BIELECKI Jerzy Feliks
108
0.87
0.37
8
STAWIARSKI Jarosław Piotr
59
0.47
0.20
9
SPRAWKA Lech Stanisław
677
5.45
2.29
10
WOJTAS Anna Elżbieta
252
2.03
0.85
11
GŁUCHOWSKI Krzysztof
53
0.42
0.18
12
SZCZOT Jacek Andrzej
80
0.64
0.27
13
NIWIŃSKI Adam
95
0.76
0.32
14
OLENDER Leszek
1001
8.06
3.39
15
ZIĘTEK Sławomir Dariusz
97
0.78
0.33
16
NIEĆKO Grzegorz Piotr
73
0.58
0.25
17
KOZŁOWSKI Andrzej Marek
54
0.43
0.18
18
BECZEK Czesław Stanisław
23
0.18
0.08
19
PACHOLIK Zbigniew
45
0.36
0.15
20
CHEMICZ Magdalena
64
0.51
0.22
21
KĘDZIORA Piotr Zbigniew
37
0.29
0.13
22
WRÓBLEWSKI Marek Antoni
30
0.24
0.10
23
KARCZMARZ Krzysztof
26
0.20
0.09
24
KWIATOSZ Mirosław Zbigniew
464
3.74
1.57
25
MACH Jadwiga
84
0.67
0.28
26
KUSZ Jacek Mariusz
16
0.12
0.05
27
BURAK Janusz
40
0.32
0.14
28
WINIARSKI Piotr Michał
183
1.47
0.62
29
PYSZNIAK Zdzisław
44
0.35
0.15
30
JAWOR Grzegorz
164
1.32
0.55
Σ
12404
100.00
41.97
.
.
Voting Results by location of ward electoral commission.
.
.
.
.
.
.
.
.
.
.
.
.
.
.
.
.
.
No.
Name
No. of entitled
to vote
No. of ballot
papers issued
No. of votes
No. of votes: per list / valid [%]
total
valid
per List
1
City
35480
20410
20390
20178
8127
40.28
2
Country
23475
9607
9596
9376
4277
45.62
.
Voting Results by number of inhabitants of commune
.
1
to 5 000
3229
1315
1315
1283
597
46.53
2
from 5 001 to 10 000
13786
5673
5671
5546
2639
47.58
3
from 10 001 to 20 000
8618
3751
3742
3657
1472
40.25
4
from 20 001 to 50 000
33322
19278
19258
19068
7696
40.36
5
from 50 001 to 100 000
0
0
0
0
0
0.00
6
from 100 001 to 200 000
0
0
0
0
0
0.00
7
from 200 001 to 500 000
0
0
0
0
0
0.00
8
over 500 000
0
0
0
0
0
0.00
Legal Acts
Documents
Electoral Bodies
Election Committees and Candidates
Turnout
Results
Statistical Data
SENATE
Created by
Copyright © 2007
Mikrobit Sp. z o.o.
. All Rights Reserved.
top