.
.
Legal Acts
Documents
Electoral Bodies
Election Committees and Candidates
Turnout
Results
Statistical Data
SENATE
Created by
.
.
Voting Results
.
.
.
Voting Results for Committee
.
.
.
.
.
.
.
.
.
.
.
.
.
.
.
.
.
.
.
.
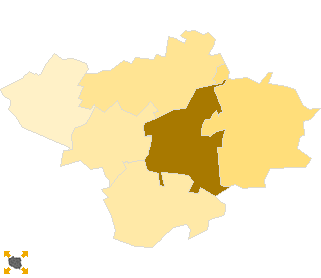
Polska
/
Lublin
/
łęczyński, pow.
...
Komitet Wyborczy Prawo i Sprawiedliwość
List's Number:
6
No. of valid votes:
19970
No. of votes per List:
9232
46.23%
lack
38.79%
41.67%
44.55%
47.43%
50.31%
53.19%
56.07%
58.95%
61.83%
64.71%
not
of data
41.66%
44.54%
47.42%
50.30%
53.18%
56.06%
58.94%
61.82%
64.70%
67.59%
applicable
See also:
Turnout
Votes per Lists
Votes per Candidates
Information about Election Committee
Election results
Voting Results by location of ward electoral commission
.
.
Voting Results for Committee.
.
.
.
.
.
.
.
.
.
.
.
.
.
.
.
.
.
No.
Name
No. of entitled
to vote
No. of ballot papers
issued
No. of votes
No. of votes: per list / valid [%]
total
valid
per List
061001
Cyców, gm.
5841
2393
2392
2315
1103
47.65
061002
Ludwin, gm.
3792
1443
1443
1402
652
46.50
061003
Łęczna, gm.
19297
10114
10083
9921
4392
44.27
061004
Milejów, gm.
7273
2804
2804
2717
1133
41.70
061005
Puchaczów, gm.
4000
2005
2005
1911
1291
67.56
061006
Spiczyn, gm.
4098
1745
1745
1704
661
38.79
łęczyński, pow.
44301
20504
20472
19970
9232
46.23
.
.
Voting Results for Candidates
.
.
.
.
.
.
.
.
.
.
.
.
.
.
.
No.
Surname Names
No. of votes
% No. of votes per candidate/No. per list
% No. of votes per candidate/No. of valid votes
1
KRUK Elżbieta Małgorzata
1319
14.28
6.60
2
MICHAŁKIEWICZ Krzysztof Stefan
199
2.15
1.00
3
SADURSKA Małgorzata Barbara
168
1.81
0.84
4
ŻACZEK Jarosław
128
1.38
0.64
5
MASŁOWSKA Gabriela
376
4.07
1.88
6
PODKAŃSKI Krzysztof Piotr
364
3.94
1.82
7
BIELECKI Jerzy Feliks
42
0.45
0.21
8
STAWIARSKI Jarosław Piotr
23
0.24
0.12
9
SPRAWKA Lech Stanisław
274
2.96
1.37
10
WOJTAS Anna Elżbieta
84
0.90
0.42
11
GŁUCHOWSKI Krzysztof
19
0.20
0.10
12
SZCZOT Jacek Andrzej
34
0.36
0.17
13
NIWIŃSKI Adam
3149
34.10
15.77
14
OLENDER Leszek
41
0.44
0.21
15
ZIĘTEK Sławomir Dariusz
27
0.29
0.14
16
NIEĆKO Grzegorz Piotr
33
0.35
0.17
17
KOZŁOWSKI Andrzej Marek
22
0.23
0.11
18
BECZEK Czesław Stanisław
7
0.07
0.04
19
PACHOLIK Zbigniew
14
0.15
0.07
20
CHEMICZ Magdalena
14
0.15
0.07
21
KĘDZIORA Piotr Zbigniew
19
0.20
0.10
22
WRÓBLEWSKI Marek Antoni
24
0.25
0.12
23
KARCZMARZ Krzysztof
16
0.17
0.08
24
KWIATOSZ Mirosław Zbigniew
13
0.14
0.07
25
MACH Jadwiga
29
0.31
0.15
26
KUSZ Jacek Mariusz
12
0.12
0.06
27
BURAK Janusz
29
0.31
0.15
28
WINIARSKI Piotr Michał
2664
28.85
13.34
29
PYSZNIAK Zdzisław
11
0.11
0.06
30
JAWOR Grzegorz
78
0.84
0.39
Σ
9232
100.00
46.22
.
.
Voting Results by location of ward electoral commission.
.
.
.
.
.
.
.
.
.
.
.
.
.
.
.
.
.
No.
Name
No. of entitled
to vote
No. of ballot
papers issued
No. of votes
No. of votes: per list / valid [%]
total
valid
per List
1
City
16506
8928
8897
8775
3808
43.40
2
Country
27795
11576
11575
11195
5424
48.45
.
Voting Results by number of inhabitants of commune
.
1
to 5 000
4000
2005
2005
1911
1291
67.56
2
from 5 001 to 10 000
21004
8385
8384
8138
3549
43.61
3
from 10 001 to 20 000
0
0
0
0
0
0.00
4
from 20 001 to 50 000
19297
10114
10083
9921
4392
44.27
5
from 50 001 to 100 000
0
0
0
0
0
0.00
6
from 100 001 to 200 000
0
0
0
0
0
0.00
7
from 200 001 to 500 000
0
0
0
0
0
0.00
8
over 500 000
0
0
0
0
0
0.00
Legal Acts
Documents
Electoral Bodies
Election Committees and Candidates
Turnout
Results
Statistical Data
SENATE
Created by
Copyright © 2007
Mikrobit Sp. z o.o.
. All Rights Reserved.
top