.
.
Legal Acts
Documents
Electoral Bodies
Election Committees and Candidates
Turnout
Results
Statistical Data
SENATE
Created by
.
.
Voting Results
.
.
.
Voting Results for Committee
.
.
.
.
.
.
.
.
.
.
.
.
.
.
.
.
.
.
.
.
Polska
/
Toruń
/
wąbrzeski, pow.
...
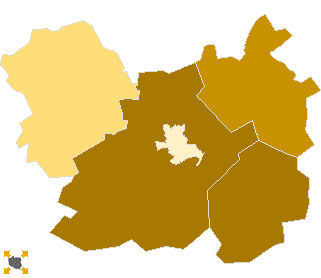
Komitet Wyborczy Prawo i Sprawiedliwość
List's Number:
6
No. of valid votes:
11164
No. of votes per List:
2423
21.70%
lack
19.70%
20.18%
20.66%
21.14%
21.62%
22.10%
22.58%
23.06%
23.54%
24.02%
not
of data
20.17%
20.65%
21.13%
21.61%
22.09%
22.57%
23.05%
23.53%
24.01%
24.50%
applicable
See also:
Turnout
Votes per Lists
Votes per Candidates
Information about Election Committee
Election results
Voting Results by location of ward electoral commission
.
.
Voting Results for Committee.
.
.
.
.
.
.
.
.
.
.
.
.
.
.
.
.
.
No.
Name
No. of entitled
to vote
No. of ballot papers
issued
No. of votes
No. of votes: per list / valid [%]
total
valid
per List
041702
Dębowa Łąka, gm.
2461
972
972
946
231
24.42
041703
Książki, gm.
3379
1332
1331
1298
307
23.65
041704
Płużnica, gm.
3876
1469
1468
1430
307
21.47
041705
Wąbrzeźno, gm.
6628
2371
2370
2328
561
24.10
041701
Wąbrzeźno, m.
11249
5297
5297
5162
1017
19.70
wąbrzeski, pow.
27593
11441
11438
11164
2423
21.70
.
.
Voting Results for Candidates
.
.
.
.
.
.
.
.
.
.
.
.
.
.
.
No.
Surname Names
No. of votes
% No. of votes per candidate/No. per list
% No. of votes per candidate/No. of valid votes
1
ZBONIKOWSKI Łukasz
379
15.64
3.39
2
GIRZYŃSKI Zbigniew
501
20.67
4.49
3
SOBECKA Anna Elżbieta
400
16.50
3.58
4
DRAB Marzenna Stefania
76
3.13
0.68
5
DOBROŚ Janusz Andrzej
28
1.15
0.25
6
GRZYBOWSKI Paweł
63
2.60
0.56
7
PODKAŃSKI Krzysztof Jan
55
2.26
0.49
8
SZYMAŃSKI Sławomir Andrzej
46
1.89
0.41
9
BIELECKI Gerard Benedykt
84
3.46
0.75
10
KALINOWSKI Piotr Paweł
89
3.67
0.80
11
MACIEJEWSKI Piotr
31
1.27
0.28
12
ROZWADOWSKA-WALCZAK Ewa Helena
30
1.23
0.27
13
MOMOT Rafał Przemysław
25
1.03
0.22
14
WOJNOWSKI Witold Piotr
415
17.12
3.72
15
BANACHOWICZ Bożena Stanisława
27
1.11
0.24
16
REMBEZA Mariusz
8
0.33
0.07
17
ZDROJEWSKI Lech Jan
22
0.90
0.20
18
KOWALSKI Piotr Jarosław
17
0.70
0.15
19
CZAJKA Krzysztof
28
1.15
0.25
20
BANASZAK Adam Heliodor
20
0.82
0.18
21
ŚMIETANA Krzysztof Stanisław
8
0.33
0.07
22
SZLITKUS Grzegorz Wojciech
0
0.00
0.00
23
ŚMIECIKOWSKI Antoni
4
0.16
0.04
24
PIOTROWICZ Artur
4
0.16
0.04
25
WASILUK Andrzej Piotr
15
0.61
0.13
26
GĘSICKI Przemysław Mieczysław
48
1.98
0.43
Σ
2423
100.00
21.70
.
.
Voting Results by location of ward electoral commission.
.
.
.
.
.
.
.
.
.
.
.
.
.
.
.
.
.
No.
Name
No. of entitled
to vote
No. of ballot
papers issued
No. of votes
No. of votes: per list / valid [%]
total
valid
per List
1
City
11249
5297
5297
5162
1017
19.70
2
Country
16344
6144
6141
6002
1406
23.43
.
Voting Results by number of inhabitants of commune
.
1
to 5 000
5840
2304
2303
2244
538
23.98
2
from 5 001 to 10 000
10504
3840
3838
3758
868
23.10
3
from 10 001 to 20 000
11249
5297
5297
5162
1017
19.70
4
from 20 001 to 50 000
0
0
0
0
0
0.00
5
from 50 001 to 100 000
0
0
0
0
0
0.00
6
from 100 001 to 200 000
0
0
0
0
0
0.00
7
from 200 001 to 500 000
0
0
0
0
0
0.00
8
over 500 000
0
0
0
0
0
0.00
Legal Acts
Documents
Electoral Bodies
Election Committees and Candidates
Turnout
Results
Statistical Data
SENATE
Created by
Copyright © 2007
Mikrobit Sp. z o.o.
. All Rights Reserved.
top