.
.
Legal Acts
Documents
Electoral Bodies
Election Committees and Candidates
Turnout
Results
Statistical Data
SENATE
Created by
.
.
Voting Results
.
.
.
Voting Results for Committee
.
.
.
.
.
.
.
.
.
.
.
.
.
.
.
.
.
.
.
.
Polska
/
Toruń
/
radziejowski, pow.
...
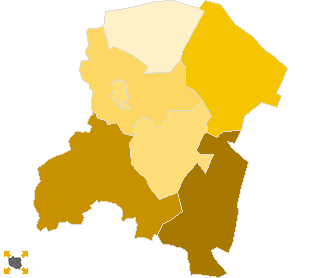
Komitet Wyborczy Prawo i Sprawiedliwość
List's Number:
6
No. of valid votes:
13082
No. of votes per List:
3548
27.12%
lack
22.43%
23.26%
24.09%
24.92%
25.75%
26.58%
27.41%
28.24%
29.07%
29.90%
not
of data
23.25%
24.08%
24.91%
25.74%
26.57%
27.40%
28.23%
29.06%
29.89%
30.73%
applicable
See also:
Turnout
Votes per Lists
Votes per Candidates
Information about Election Committee
Election results
Voting Results by location of ward electoral commission
.
.
Voting Results for Committee.
.
.
.
.
.
.
.
.
.
.
.
.
.
.
.
.
.
No.
Name
No. of entitled
to vote
No. of ballot papers
issued
No. of votes
No. of votes: per list / valid [%]
total
valid
per List
041102
Bytoń, gm.
3035
1112
1111
1068
272
25.47
041103
Dobre, gm.
4441
1750
1750
1676
376
22.43
041104
Osięciny, gm.
6551
2365
2363
2290
632
27.60
041105
Piotrków Kujawski, gm.
7664
2992
2989
2875
857
29.81
041106
Radziejów, gm.
3496
1275
1252
1212
322
26.57
041101
Radziejów, m.
5027
2551
2547
2466
631
25.59
041107
Topólka, gm.
4056
1547
1547
1495
458
30.64
radziejowski, pow.
34270
13592
13559
13082
3548
27.12
.
.
Voting Results for Candidates
.
.
.
.
.
.
.
.
.
.
.
.
.
.
.
No.
Surname Names
No. of votes
% No. of votes per candidate/No. per list
% No. of votes per candidate/No. of valid votes
1
ZBONIKOWSKI Łukasz
1258
35.45
9.62
2
GIRZYŃSKI Zbigniew
229
6.45
1.75
3
SOBECKA Anna Elżbieta
605
17.05
4.62
4
DRAB Marzenna Stefania
58
1.63
0.44
5
DOBROŚ Janusz Andrzej
47
1.32
0.36
6
GRZYBOWSKI Paweł
87
2.45
0.67
7
PODKAŃSKI Krzysztof Jan
46
1.29
0.35
8
SZYMAŃSKI Sławomir Andrzej
130
3.66
0.99
9
BIELECKI Gerard Benedykt
38
1.07
0.29
10
KALINOWSKI Piotr Paweł
552
15.55
4.22
11
MACIEJEWSKI Piotr
67
1.88
0.51
12
ROZWADOWSKA-WALCZAK Ewa Helena
37
1.04
0.28
13
MOMOT Rafał Przemysław
26
0.73
0.20
14
WOJNOWSKI Witold Piotr
23
0.64
0.18
15
BANACHOWICZ Bożena Stanisława
64
1.80
0.49
16
REMBEZA Mariusz
18
0.50
0.14
17
ZDROJEWSKI Lech Jan
34
0.95
0.26
18
KOWALSKI Piotr Jarosław
56
1.57
0.43
19
CZAJKA Krzysztof
23
0.64
0.18
20
BANASZAK Adam Heliodor
23
0.64
0.18
21
ŚMIETANA Krzysztof Stanisław
26
0.73
0.20
22
SZLITKUS Grzegorz Wojciech
6
0.16
0.05
23
ŚMIECIKOWSKI Antoni
12
0.33
0.09
24
PIOTROWICZ Artur
22
0.62
0.17
25
WASILUK Andrzej Piotr
4
0.11
0.03
26
GĘSICKI Przemysław Mieczysław
57
1.60
0.44
Σ
3548
100.00
27.12
.
.
Voting Results by location of ward electoral commission.
.
.
.
.
.
.
.
.
.
.
.
.
.
.
.
.
.
No.
Name
No. of entitled
to vote
No. of ballot
papers issued
No. of votes
No. of votes: per list / valid [%]
total
valid
per List
1
City
8596
4173
4167
4033
1081
26.80
2
Country
25674
9419
9392
9049
2467
27.26
.
Voting Results by number of inhabitants of commune
.
1
to 5 000
6531
2387
2363
2280
594
26.05
2
from 5 001 to 10 000
27739
11205
11196
10802
2954
27.35
3
from 10 001 to 20 000
0
0
0
0
0
0.00
4
from 20 001 to 50 000
0
0
0
0
0
0.00
5
from 50 001 to 100 000
0
0
0
0
0
0.00
6
from 100 001 to 200 000
0
0
0
0
0
0.00
7
from 200 001 to 500 000
0
0
0
0
0
0.00
8
over 500 000
0
0
0
0
0
0.00
Legal Acts
Documents
Electoral Bodies
Election Committees and Candidates
Turnout
Results
Statistical Data
SENATE
Created by
Copyright © 2007
Mikrobit Sp. z o.o.
. All Rights Reserved.
top