.
.
Legal Acts
Documents
Electoral Bodies
Election Committees and Candidates
Turnout
Results
Statistical Data
SENATE
Created by
.
.
Voting Results
.
.
.
Voting Results for Committee
.
.
.
.
.
.
.
.
.
.
.
.
.
.
.
.
.
.
.
.
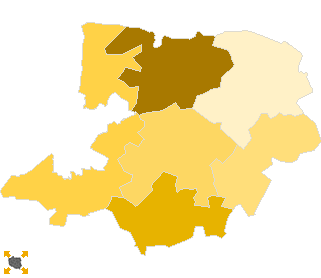
Polska
/
Toruń
/
grudziądzki, pow.
...
Komitet Wyborczy Prawo i Sprawiedliwość
List's Number:
6
No. of valid votes:
11361
No. of votes per List:
3129
27.54%
lack
23.93%
24.74%
25.55%
26.36%
27.17%
27.98%
28.79%
29.60%
30.41%
31.22%
not
of data
24.73%
25.54%
26.35%
27.16%
27.97%
28.78%
29.59%
30.40%
31.21%
32.03%
applicable
See also:
Turnout
Votes per Lists
Votes per Candidates
Information about Election Committee
Election results
Voting Results by location of ward electoral commission
.
.
Voting Results for Committee.
.
.
.
.
.
.
.
.
.
.
.
.
.
.
.
.
.
No.
Name
No. of entitled
to vote
No. of ballot papers
issued
No. of votes
No. of votes: per list / valid [%]
total
valid
per List
040601
Grudziądz, gm.
8296
3518
3517
3433
967
28.17
040602
Gruta, gm.
5150
2041
2041
1971
549
27.85
040603
Łasin, gm.
6568
2655
2654
2557
612
23.93
040604
Radzyń Chełmiński, gm.
3701
1317
1317
1286
383
29.78
040605
Rogóźno, gm.
3115
1089
1089
1058
338
31.95
040606
Świecie nad Osą, gm.
3385
1104
1104
1056
280
26.52
grudziądzki, pow.
30215
11724
11722
11361
3129
27.54
.
.
Voting Results for Candidates
.
.
.
.
.
.
.
.
.
.
.
.
.
.
.
No.
Surname Names
No. of votes
% No. of votes per candidate/No. per list
% No. of votes per candidate/No. of valid votes
1
ZBONIKOWSKI Łukasz
389
12.43
3.42
2
GIRZYŃSKI Zbigniew
354
11.31
3.12
3
SOBECKA Anna Elżbieta
467
14.92
4.11
4
DRAB Marzenna Stefania
721
23.04
6.35
5
DOBROŚ Janusz Andrzej
38
1.21
0.33
6
GRZYBOWSKI Paweł
76
2.42
0.67
7
PODKAŃSKI Krzysztof Jan
55
1.75
0.48
8
SZYMAŃSKI Sławomir Andrzej
284
9.07
2.50
9
BIELECKI Gerard Benedykt
38
1.21
0.33
10
KALINOWSKI Piotr Paweł
100
3.19
0.88
11
MACIEJEWSKI Piotr
37
1.18
0.33
12
ROZWADOWSKA-WALCZAK Ewa Helena
37
1.18
0.33
13
MOMOT Rafał Przemysław
14
0.44
0.12
14
WOJNOWSKI Witold Piotr
36
1.15
0.32
15
BANACHOWICZ Bożena Stanisława
26
0.83
0.23
16
REMBEZA Mariusz
14
0.44
0.12
17
ZDROJEWSKI Lech Jan
19
0.60
0.17
18
KOWALSKI Piotr Jarosław
30
0.95
0.26
19
CZAJKA Krzysztof
33
1.05
0.29
20
BANASZAK Adam Heliodor
19
0.60
0.17
21
ŚMIETANA Krzysztof Stanisław
15
0.47
0.13
22
SZLITKUS Grzegorz Wojciech
275
8.78
2.42
23
ŚMIECIKOWSKI Antoni
6
0.19
0.05
24
PIOTROWICZ Artur
7
0.22
0.06
25
WASILUK Andrzej Piotr
11
0.35
0.10
26
GĘSICKI Przemysław Mieczysław
28
0.89
0.25
Σ
3129
100.00
27.54
.
.
Voting Results by location of ward electoral commission.
.
.
.
.
.
.
.
.
.
.
.
.
.
.
.
.
.
No.
Name
No. of entitled
to vote
No. of ballot
papers issued
No. of votes
No. of votes: per list / valid [%]
total
valid
per List
1
City
5157
2334
2333
2255
541
23.99
2
Country
25058
9390
9389
9106
2588
28.42
.
Voting Results by number of inhabitants of commune
.
1
to 5 000
6500
2193
2193
2114
618
29.23
2
from 5 001 to 10 000
15419
6013
6012
5814
1544
26.56
3
from 10 001 to 20 000
8296
3518
3517
3433
967
28.17
4
from 20 001 to 50 000
0
0
0
0
0
0.00
5
from 50 001 to 100 000
0
0
0
0
0
0.00
6
from 100 001 to 200 000
0
0
0
0
0
0.00
7
from 200 001 to 500 000
0
0
0
0
0
0.00
8
over 500 000
0
0
0
0
0
0.00
Legal Acts
Documents
Electoral Bodies
Election Committees and Candidates
Turnout
Results
Statistical Data
SENATE
Created by
Copyright © 2007
Mikrobit Sp. z o.o.
. All Rights Reserved.
top