.
.
Legal Acts
Documents
Electoral Bodies
Election Committees and Candidates
Turnout
Results
Statistical Data
SENATE
Created by
.
.
Voting Results
.
.
.
Voting Results for Committee
.
.
.
.
.
.
.
.
.
.
.
.
.
.
.
.
.
.
.
.
Polska
/
Toruń
/
chełmiński, pow.
...
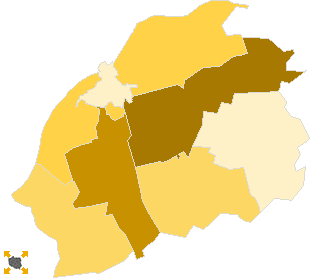
Komitet Wyborczy Prawo i Sprawiedliwość
List's Number:
6
No. of valid votes:
17384
No. of votes per List:
4587
26.39%
lack
24.24%
24.98%
25.72%
26.46%
27.20%
27.94%
28.68%
29.42%
30.16%
30.90%
not
of data
24.97%
25.71%
26.45%
27.19%
27.93%
28.67%
29.41%
30.15%
30.89%
31.64%
applicable
See also:
Turnout
Votes per Lists
Votes per Candidates
Information about Election Committee
Election results
Voting Results by location of ward electoral commission
.
.
Voting Results for Committee.
.
.
.
.
.
.
.
.
.
.
.
.
.
.
.
.
.
No.
Name
No. of entitled
to vote
No. of ballot papers
issued
No. of votes
No. of votes: per list / valid [%]
total
valid
per List
040402
Chełmno, gm.
3923
1500
1490
1451
408
28.12
040401
Chełmno, m.
16635
8264
8252
8047
1951
24.25
040403
Kijewo Królewskie, gm.
3375
1416
1416
1363
414
30.37
040404
Lisewo, gm.
4002
1546
1546
1499
365
24.35
040405
Papowo Biskupie, gm.
3392
1284
1284
1249
348
27.86
040406
Stolno, gm.
3866
1446
1446
1420
449
31.62
040407
Unisław, gm.
5282
2415
2414
2355
652
27.69
chełmiński, pow.
40475
17871
17848
17384
4587
26.39
.
.
Voting Results for Candidates
.
.
.
.
.
.
.
.
.
.
.
.
.
.
.
No.
Surname Names
No. of votes
% No. of votes per candidate/No. per list
% No. of votes per candidate/No. of valid votes
1
ZBONIKOWSKI Łukasz
808
17.61
4.65
2
GIRZYŃSKI Zbigniew
1109
24.17
6.38
3
SOBECKA Anna Elżbieta
910
19.83
5.23
4
DRAB Marzenna Stefania
313
6.82
1.80
5
DOBROŚ Janusz Andrzej
38
0.82
0.22
6
GRZYBOWSKI Paweł
84
1.83
0.48
7
PODKAŃSKI Krzysztof Jan
59
1.28
0.34
8
SZYMAŃSKI Sławomir Andrzej
74
1.61
0.43
9
BIELECKI Gerard Benedykt
60
1.30
0.35
10
KALINOWSKI Piotr Paweł
110
2.39
0.63
11
MACIEJEWSKI Piotr
51
1.11
0.29
12
ROZWADOWSKA-WALCZAK Ewa Helena
66
1.43
0.38
13
MOMOT Rafał Przemysław
365
7.95
2.10
14
WOJNOWSKI Witold Piotr
62
1.35
0.36
15
BANACHOWICZ Bożena Stanisława
35
0.76
0.20
16
REMBEZA Mariusz
172
3.74
0.99
17
ZDROJEWSKI Lech Jan
35
0.76
0.20
18
KOWALSKI Piotr Jarosław
53
1.15
0.30
19
CZAJKA Krzysztof
40
0.87
0.23
20
BANASZAK Adam Heliodor
36
0.78
0.21
21
ŚMIETANA Krzysztof Stanisław
15
0.32
0.09
22
SZLITKUS Grzegorz Wojciech
4
0.08
0.02
23
ŚMIECIKOWSKI Antoni
10
0.21
0.06
24
PIOTROWICZ Artur
18
0.39
0.10
25
WASILUK Andrzej Piotr
15
0.32
0.09
26
GĘSICKI Przemysław Mieczysław
45
0.98
0.26
Σ
4587
100.00
26.38
.
.
Voting Results by location of ward electoral commission.
.
.
.
.
.
.
.
.
.
.
.
.
.
.
.
.
.
No.
Name
No. of entitled
to vote
No. of ballot
papers issued
No. of votes
No. of votes: per list / valid [%]
total
valid
per List
1
City
16635
8264
8252
8047
1951
24.25
2
Country
23840
9607
9596
9337
2636
28.23
.
Voting Results by number of inhabitants of commune
.
1
to 5 000
6767
2700
2700
2612
762
29.17
2
from 5 001 to 10 000
17073
6907
6896
6725
1874
27.87
3
from 10 001 to 20 000
0
0
0
0
0
0.00
4
from 20 001 to 50 000
16635
8264
8252
8047
1951
24.25
5
from 50 001 to 100 000
0
0
0
0
0
0.00
6
from 100 001 to 200 000
0
0
0
0
0
0.00
7
from 200 001 to 500 000
0
0
0
0
0
0.00
8
over 500 000
0
0
0
0
0
0.00
Legal Acts
Documents
Electoral Bodies
Election Committees and Candidates
Turnout
Results
Statistical Data
SENATE
Created by
Copyright © 2007
Mikrobit Sp. z o.o.
. All Rights Reserved.
top