.
.
Legal Acts
Documents
Electoral Bodies
Election Committees and Candidates
Turnout
Results
Statistical Data
SENATE
Created by
.
.
Voting Results
.
.
.
Voting Results for Committee
.
.
.
.
.
.
.
.
.
.
.
.
.
.
.
.
.
.
.
.
Polska
/
Wrocław
/
trzebnicki, pow.
...
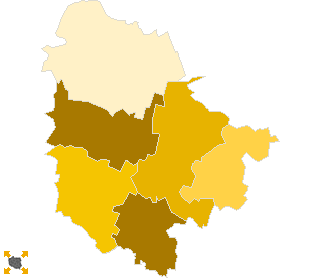
Komitet Wyborczy Prawo i Sprawiedliwość
List's Number:
6
No. of valid votes:
29273
No. of votes per List:
9262
31.64%
lack
20.25%
22.05%
23.85%
25.65%
27.45%
29.25%
31.05%
32.85%
34.65%
36.45%
not
of data
22.04%
23.84%
25.64%
27.44%
29.24%
31.04%
32.84%
34.64%
36.44%
38.25%
applicable
See also:
Turnout
Votes per Lists
Votes per Candidates
Information about Election Committee
Election results
Voting Results by location of ward electoral commission
.
.
Voting Results for Committee.
.
.
.
.
.
.
.
.
.
.
.
.
.
.
.
.
.
No.
Name
No. of entitled
to vote
No. of ballot papers
issued
No. of votes
No. of votes: per list / valid [%]
total
valid
per List
022001
Oborniki Śląskie, gm.
14417
7933
7929
7801
2440
31.28
022002
Prusice, gm.
7239
2774
2773
2662
973
36.55
022003
Trzebnica, gm.
17484
8870
8861
8702
2999
34.46
022004
Wisznia Mała, gm.
6636
3578
3575
3511
1340
38.17
022005
Zawonia, gm.
4250
1682
1682
1660
510
30.72
022006
Żmigród, gm.
11830
5153
5101
4937
1000
20.26
trzebnicki, pow.
61856
29990
29921
29273
9262
31.64
.
.
Voting Results for Candidates
.
.
.
.
.
.
.
.
.
.
.
.
.
.
.
No.
Surname Names
No. of votes
% No. of votes per candidate/No. per list
% No. of votes per candidate/No. of valid votes
1
UJAZDOWSKI Kazimierz Michał
2472
26.68
8.44
2
NATALLI-ŚWIAT Aleksandra Krystyna
2901
31.32
9.91
3
JACKIEWICZ Dawid Bohdan
475
5.12
1.62
4
KEMPA Beata Agnieszka
227
2.45
0.78
5
KILIAN Wiesław
135
1.45
0.46
6
REGIEC Piotr Roman
109
1.17
0.37
7
BREWKA Andrzej Wojciech
1343
14.50
4.59
8
SZCZYRBAK Tadeusz
62
0.66
0.21
9
KOFLUK Andrzej Zdzisław
26
0.28
0.09
10
CZARTORYSKI Tytus Henryk
547
5.90
1.87
11
ŁĄCZYŃSKI Krzysztof
41
0.44
0.14
12
PATKOWSKI Leon Janusz
25
0.26
0.09
13
PIOTROWSKA Iwona Maria
82
0.88
0.28
14
BOGUCKI Kazimierz
53
0.57
0.18
15
GROCHOWSKI Waldemar Ryszard
48
0.51
0.16
16
KOWALCZYK Roman
82
0.88
0.28
17
CZEPIL Rafał Janusz
19
0.20
0.06
18
HORYŃ Jolanta Bożena
45
0.48
0.15
19
LISOWSKI Mirosław Stanisław
200
2.15
0.68
20
MAKOWSKI Ryszard Maksymilian
27
0.29
0.09
21
RUDNICKA Krystyna
76
0.82
0.26
22
CIOŁEK Łukasz Tadeusz
33
0.35
0.11
23
KOCHAŃSKI Jacek Tomasz
37
0.39
0.13
24
KRAWCZYK Paulina
70
0.75
0.24
25
JAKÓBCZYŃSKI Robert Bartosz
12
0.12
0.04
26
MALCZEWSKI Grzegorz Jan
21
0.22
0.07
27
NIEDŹWIEDŹ Sabina Mieczysława
30
0.32
0.10
28
MILCZANOWSKI Piotr
64
0.69
0.22
Σ
9262
100.00
31.64
.
.
Voting Results by location of ward electoral commission.
.
.
.
.
.
.
.
.
.
.
.
.
.
.
.
.
.
No.
Name
No. of entitled
to vote
No. of ballot
papers issued
No. of votes
No. of votes: per list / valid [%]
total
valid
per List
1
City
26238
14825
14760
14506
4130
28.47
2
Country
35618
15165
15161
14767
5132
34.75
.
Voting Results by number of inhabitants of commune
.
1
to 5 000
0
0
0
0
0
0.00
2
from 5 001 to 10 000
18125
8034
8030
7833
2823
36.04
3
from 10 001 to 20 000
26247
13086
13030
12738
3440
27.01
4
from 20 001 to 50 000
17484
8870
8861
8702
2999
34.46
5
from 50 001 to 100 000
0
0
0
0
0
0.00
6
from 100 001 to 200 000
0
0
0
0
0
0.00
7
from 200 001 to 500 000
0
0
0
0
0
0.00
8
over 500 000
0
0
0
0
0
0.00
Legal Acts
Documents
Electoral Bodies
Election Committees and Candidates
Turnout
Results
Statistical Data
SENATE
Created by
Copyright © 2007
Mikrobit Sp. z o.o.
. All Rights Reserved.
top