.
.
Legal Acts
Documents
Electoral Bodies
Election Committees and Candidates
Turnout
Results
Statistical Data
SENATE
Created by
.
.
Voting Results
.
.
.
Voting Results for Committee
.
.
.
.
.
.
.
.
.
.
.
.
.
.
.
.
.
.
.
.
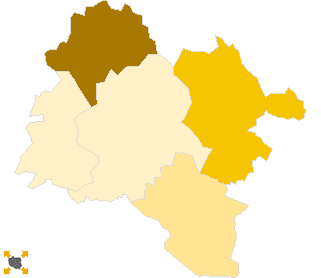
Polska
/
Wrocław
/
strzeliński, pow.
...
Komitet Wyborczy Prawo i Sprawiedliwość
List's Number:
6
No. of valid votes:
16766
No. of votes per List:
5637
33.62%
lack
27.78%
30.07%
32.36%
34.65%
36.94%
39.23%
41.52%
43.81%
46.10%
48.39%
not
of data
30.06%
32.35%
34.64%
36.93%
39.22%
41.51%
43.80%
46.09%
48.38%
50.68%
applicable
See also:
Turnout
Votes per Lists
Votes per Candidates
Information about Election Committee
Election results
Voting Results by location of ward electoral commission
.
.
Voting Results for Committee.
.
.
.
.
.
.
.
.
.
.
.
.
.
.
.
.
.
No.
Name
No. of entitled
to vote
No. of ballot papers
issued
No. of votes
No. of votes: per list / valid [%]
total
valid
per List
021701
Borów, gm.
4180
2119
2119
2066
1047
50.68
021702
Kondratowice, gm.
3764
1532
1526
1492
444
29.76
021703
Przeworno, gm.
4170
1682
1682
1631
554
33.97
021704
Strzelin, gm.
18421
9382
9365
9216
2561
27.79
021705
Wiązów, gm.
5962
2426
2425
2361
1031
43.67
strzeliński, pow.
36497
17141
17117
16766
5637
33.62
.
.
Voting Results for Candidates
.
.
.
.
.
.
.
.
.
.
.
.
.
.
.
No.
Surname Names
No. of votes
% No. of votes per candidate/No. per list
% No. of votes per candidate/No. of valid votes
1
UJAZDOWSKI Kazimierz Michał
1821
32.30
10.86
2
NATALLI-ŚWIAT Aleksandra Krystyna
433
7.68
2.58
3
JACKIEWICZ Dawid Bohdan
206
3.65
1.23
4
KEMPA Beata Agnieszka
88
1.56
0.52
5
KILIAN Wiesław
253
4.48
1.51
6
REGIEC Piotr Roman
70
1.24
0.42
7
BREWKA Andrzej Wojciech
32
0.56
0.19
8
SZCZYRBAK Tadeusz
51
0.90
0.30
9
KOFLUK Andrzej Zdzisław
27
0.47
0.16
10
CZARTORYSKI Tytus Henryk
50
0.88
0.30
11
ŁĄCZYŃSKI Krzysztof
25
0.44
0.15
12
PATKOWSKI Leon Janusz
21
0.37
0.13
13
PIOTROWSKA Iwona Maria
52
0.92
0.31
14
BOGUCKI Kazimierz
62
1.09
0.37
15
GROCHOWSKI Waldemar Ryszard
2044
36.26
12.19
16
KOWALCZYK Roman
65
1.15
0.39
17
CZEPIL Rafał Janusz
12
0.21
0.07
18
HORYŃ Jolanta Bożena
27
0.47
0.16
19
LISOWSKI Mirosław Stanisław
43
0.76
0.26
20
MAKOWSKI Ryszard Maksymilian
24
0.42
0.14
21
RUDNICKA Krystyna
54
0.95
0.32
22
CIOŁEK Łukasz Tadeusz
19
0.33
0.11
23
KOCHAŃSKI Jacek Tomasz
46
0.81
0.27
24
KRAWCZYK Paulina
30
0.53
0.18
25
JAKÓBCZYŃSKI Robert Bartosz
5
0.08
0.03
26
MALCZEWSKI Grzegorz Jan
16
0.28
0.10
27
NIEDŹWIEDŹ Sabina Mieczysława
20
0.35
0.12
28
MILCZANOWSKI Piotr
41
0.72
0.24
Σ
5637
100.00
33.62
.
.
Voting Results by location of ward electoral commission.
.
.
.
.
.
.
.
.
.
.
.
.
.
.
.
.
.
No.
Name
No. of entitled
to vote
No. of ballot
papers issued
No. of votes
No. of votes: per list / valid [%]
total
valid
per List
1
City
13677
7264
7259
7136
1849
25.91
2
Country
22820
9877
9858
9630
3788
39.34
.
Voting Results by number of inhabitants of commune
.
1
to 5 000
3764
1532
1526
1492
444
29.76
2
from 5 001 to 10 000
14312
6227
6226
6058
2632
43.45
3
from 10 001 to 20 000
0
0
0
0
0
0.00
4
from 20 001 to 50 000
18421
9382
9365
9216
2561
27.79
5
from 50 001 to 100 000
0
0
0
0
0
0.00
6
from 100 001 to 200 000
0
0
0
0
0
0.00
7
from 200 001 to 500 000
0
0
0
0
0
0.00
8
over 500 000
0
0
0
0
0
0.00
Legal Acts
Documents
Electoral Bodies
Election Committees and Candidates
Turnout
Results
Statistical Data
SENATE
Created by
Copyright © 2007
Mikrobit Sp. z o.o.
. All Rights Reserved.
top