.
.
Legal Acts
Documents
Electoral Bodies
Election Committees and Candidates
Turnout
Results
Statistical Data
SENATE
Created by
.
.
Voting Results
.
.
.
Voting Results for Committee
.
.
.
.
.
.
.
.
.
.
.
.
.
.
.
.
.
.
.
.
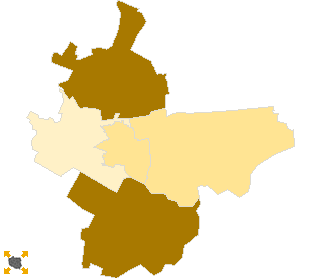
Polska
/
Kielce
/
starachowicki, pow.
...
Komitet Wyborczy Liga Polskich Rodzin
List's Number:
3
No. of valid votes:
35575
No. of votes per List:
384
1.08%
lack
0.84%
0.91%
0.98%
1.05%
1.12%
1.19%
1.26%
1.33%
1.40%
1.47%
not
of data
0.90%
0.97%
1.04%
1.11%
1.18%
1.25%
1.32%
1.39%
1.46%
1.54%
applicable
See also:
Turnout
Votes per Lists
Votes per Candidates
Information about Election Committee
Election results
Voting Results by location of ward electoral commission
.
.
Voting Results for Committee.
.
.
.
.
.
.
.
.
.
.
.
.
.
.
.
.
.
No.
Name
No. of entitled
to vote
No. of ballot papers
issued
No. of votes
No. of votes: per list / valid [%]
total
valid
per List
261102
Brody, gm.
8736
3572
3561
3455
34
0.98
261103
Mirzec, gm.
6728
3085
3084
2996
45
1.50
261104
Pawłów, gm.
11667
4282
4282
4125
61
1.48
261101
Starachowice, m.
44646
22751
22739
22293
221
0.99
261105
Wąchock, gm.
5858
2783
2782
2706
23
0.85
starachowicki, pow.
77635
36473
36448
35575
384
1.08
.
.
Voting Results for Candidates
.
.
.
.
.
.
.
.
.
.
.
.
.
.
.
No.
Surname Names
No. of votes
% No. of votes per candidate/No. per list
% No. of votes per candidate/No. of valid votes
1
PARDA Radosław
59
15.36
0.17
2
DUDEK Czesław
44
11.45
0.12
3
MIERZYŃSKI Janusz Ludwig
56
14.58
0.16
4
NOWAK Lucjana Elżbieta
84
21.87
0.24
5
WAWRECZKO Zdzisława Genowefa
3
0.78
0.01
6
SALATA Marzena
14
3.64
0.04
7
DOMERACKI Jan
5
1.30
0.01
8
CZAJA Józef
18
4.68
0.05
9
GRANDYS Andrzej Aleksander
4
1.04
0.01
10
STACHURSKI Robert Zdzisław
11
2.86
0.03
11
PUSTUŁA Dariusz
6
1.56
0.02
12
JÓZEFOWSKI Kamil Krzysztof
8
2.08
0.02
13
STEMPLEWSKI Krzysztof
4
1.04
0.01
14
BIŃCZYK Kamil
6
1.56
0.02
15
WOJSA Leszek Franciszek
0
0.00
0.00
16
SMOLARCZYK Łukasz
4
1.04
0.01
17
APRYASZ Leszek
2
0.52
0.01
18
ZABROCKI Dariusz
6
1.56
0.02
19
SZWARC Jacenty Stanisław
0
0.00
0.00
20
WERBSKI Artur
8
2.08
0.02
21
GALIŃSKI Jacek Tomasz
7
1.82
0.02
22
DOROBEK Grzegorz Piotr
0
0.00
0.00
23
KUŚMIERZ Grzegorz Adam
5
1.30
0.01
24
GRUSZCZYŃSKI Maciej
5
1.30
0.01
25
DZIAREK Iwona Teresa
0
0.00
0.00
26
STAŃCZYK Jerzy Rajmund
4
1.04
0.01
27
BEDNARCZYK Marek
3
0.78
0.01
28
MATLAK Wiesław
0
0.00
0.00
29
SIKORSKA Janina
4
1.04
0.01
30
WILK Anzelm
8
2.08
0.02
31
SZAREK Sławomir Aleksander
3
0.78
0.01
32
KUSAK Paweł Robert
3
0.78
0.01
Σ
384
100.00
1.07
.
.
Voting Results by location of ward electoral commission.
.
.
.
.
.
.
.
.
.
.
.
.
.
.
.
.
.
No.
Name
No. of entitled
to vote
No. of ballot
papers issued
No. of votes
No. of votes: per list / valid [%]
total
valid
per List
1
City
47010
23953
23941
23464
228
0.97
2
Country
30625
12520
12507
12111
156
1.29
.
Voting Results by number of inhabitants of commune
.
1
to 5 000
0
0
0
0
0
0.00
2
from 5 001 to 10 000
12586
5868
5866
5702
68
1.19
3
from 10 001 to 20 000
20403
7854
7843
7580
95
1.25
4
from 20 001 to 50 000
0
0
0
0
0
0.00
5
from 50 001 to 100 000
44646
22751
22739
22293
221
0.99
6
from 100 001 to 200 000
0
0
0
0
0
0.00
7
from 200 001 to 500 000
0
0
0
0
0
0.00
8
over 500 000
0
0
0
0
0
0.00
Legal Acts
Documents
Electoral Bodies
Election Committees and Candidates
Turnout
Results
Statistical Data
SENATE
Created by
Copyright © 2007
Mikrobit Sp. z o.o.
. All Rights Reserved.
top