.
.
Legal Acts
Documents
Electoral Bodies
Election Committees and Candidates
Turnout
Results
Statistical Data
SENATE
Created by
.
.
Voting Results
.
.
.
Voting Results for Committee
.
.
.
.
.
.
.
.
.
.
.
.
.
.
.
.
.
.
.
.
Polska
/
Kielce
/
pińczowski, pow.
...
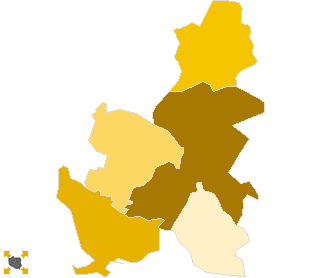
Komitet Wyborczy Liga Polskich Rodzin
List's Number:
3
No. of valid votes:
14505
No. of votes per List:
151
1.04%
lack
0.29%
0.39%
0.49%
0.59%
0.69%
0.79%
0.89%
0.99%
1.09%
1.19%
not
of data
0.38%
0.48%
0.58%
0.68%
0.78%
0.88%
0.98%
1.08%
1.18%
1.29%
applicable
See also:
Turnout
Votes per Lists
Votes per Candidates
Information about Election Committee
Election results
Voting Results by location of ward electoral commission
.
.
Voting Results for Committee.
.
.
.
.
.
.
.
.
.
.
.
.
.
.
.
.
.
No.
Name
No. of entitled
to vote
No. of ballot papers
issued
No. of votes
No. of votes: per list / valid [%]
total
valid
per List
260801
Działoszyce, gm.
4686
1751
1751
1694
17
1.00
260802
Kije, gm.
3716
1585
1585
1486
14
0.94
260803
Michałów, gm.
3936
1410
1409
1368
10
0.73
260804
Pińczów, gm.
18756
8812
8810
8582
106
1.24
260805
Złota, gm.
4008
1407
1407
1375
4
0.29
pińczowski, pow.
35102
14965
14962
14505
151
1.04
.
.
Voting Results for Candidates
.
.
.
.
.
.
.
.
.
.
.
.
.
.
.
No.
Surname Names
No. of votes
% No. of votes per candidate/No. per list
% No. of votes per candidate/No. of valid votes
1
PARDA Radosław
35
23.17
0.24
2
DUDEK Czesław
11
7.28
0.08
3
MIERZYŃSKI Janusz Ludwig
10
6.62
0.07
4
NOWAK Lucjana Elżbieta
4
2.64
0.03
5
WAWRECZKO Zdzisława Genowefa
4
2.64
0.03
6
SALATA Marzena
5
3.31
0.03
7
DOMERACKI Jan
4
2.64
0.03
8
CZAJA Józef
1
0.66
0.01
9
GRANDYS Andrzej Aleksander
1
0.66
0.01
10
STACHURSKI Robert Zdzisław
27
17.88
0.19
11
PUSTUŁA Dariusz
5
3.31
0.03
12
JÓZEFOWSKI Kamil Krzysztof
2
1.32
0.01
13
STEMPLEWSKI Krzysztof
1
0.66
0.01
14
BIŃCZYK Kamil
1
0.66
0.01
15
WOJSA Leszek Franciszek
2
1.32
0.01
16
SMOLARCZYK Łukasz
6
3.97
0.04
17
APRYASZ Leszek
1
0.66
0.01
18
ZABROCKI Dariusz
2
1.32
0.01
19
SZWARC Jacenty Stanisław
1
0.66
0.01
20
WERBSKI Artur
0
0.00
0.00
21
GALIŃSKI Jacek Tomasz
0
0.00
0.00
22
DOROBEK Grzegorz Piotr
0
0.00
0.00
23
KUŚMIERZ Grzegorz Adam
4
2.64
0.03
24
GRUSZCZYŃSKI Maciej
2
1.32
0.01
25
DZIAREK Iwona Teresa
3
1.98
0.02
26
STAŃCZYK Jerzy Rajmund
1
0.66
0.01
27
BEDNARCZYK Marek
0
0.00
0.00
28
MATLAK Wiesław
2
1.32
0.01
29
SIKORSKA Janina
2
1.32
0.01
30
WILK Anzelm
8
5.29
0.06
31
SZAREK Sławomir Aleksander
1
0.66
0.01
32
KUSAK Paweł Robert
5
3.31
0.03
Σ
151
100.00
1.04
.
.
Voting Results by location of ward electoral commission.
.
.
.
.
.
.
.
.
.
.
.
.
.
.
.
.
.
No.
Name
No. of entitled
to vote
No. of ballot
papers issued
No. of votes
No. of votes: per list / valid [%]
total
valid
per List
1
City
14087
6958
6958
6767
83
1.23
2
Country
21015
8007
8004
7738
68
0.88
.
Voting Results by number of inhabitants of commune
.
1
to 5 000
11660
4402
4401
4229
28
0.66
2
from 5 001 to 10 000
4686
1751
1751
1694
17
1.00
3
from 10 001 to 20 000
0
0
0
0
0
0.00
4
from 20 001 to 50 000
18756
8812
8810
8582
106
1.24
5
from 50 001 to 100 000
0
0
0
0
0
0.00
6
from 100 001 to 200 000
0
0
0
0
0
0.00
7
from 200 001 to 500 000
0
0
0
0
0
0.00
8
over 500 000
0
0
0
0
0
0.00
Legal Acts
Documents
Electoral Bodies
Election Committees and Candidates
Turnout
Results
Statistical Data
SENATE
Created by
Copyright © 2007
Mikrobit Sp. z o.o.
. All Rights Reserved.
top