|
See also:
|
| . |
. |
Voting Results for Committee. |
. |
. |
| . |
. |
| . |
. |
. |
. |
. |
. |
. |
. |
. |
. |
. |
. |
. |
| No. |
Name |
No. of entitled
to vote |
No. of ballot papers
issued |
No. of votes |
No. of votes: per list / valid [%] |
| total |
valid |
per List |
| 241301 | Kalety, m. | 7153 | 3399 | 3399 | 3332 | 36 | 1.08 |  |
| 241305 | Krupski Młyn, gm. | 2755 | 1408 | 1408 | 1368 | 15 | 1.10 | |
| 241302 | Miasteczko Śląskie, m. | 5945 | 2935 | 2924 | 2876 | 38 | 1.32 | |
| 241306 | Ożarowice, gm. | 4372 | 2312 | 2311 | 2255 | 27 | 1.20 | |
| 241303 | Radzionków, m. | 13801 | 7830 | 7825 | 7703 | 60 | 0.78 | |
| 241307 | Świerklaniec, gm. | 8940 | 4737 | 4736 | 4622 | 40 | 0.87 | |
| 241304 | Tarnowskie Góry, m. | 50962 | 28679 | 28662 | 28124 | 274 | 0.97 | |
| 241308 | Tworóg, gm. | 6490 | 2660 | 2660 | 2596 | 27 | 1.04 | |
| 241309 | Zbrosławice, gm. | 12451 | 4859 | 4856 | 4702 | 57 | 1.21 | |
| |
tarnogórski, pow. |
112869 |
58819 |
58781 |
57578 |
574 |
1.00 |
 |
|
| |
| . |
. |
Voting Results by location of ward electoral commission. |
. |
. |
| . |
. |
| . |
. |
. |
. |
. |
. |
. |
. |
. |
. |
. |
. |
. |
| No. |
Name |
No. of entitled
to vote |
No. of ballot
papers issued |
No. of votes |
No. of votes: per list / valid [%] |
| total |
valid |
per List |
| 1 | City | 77861 | 42843 | 42810 | 42035 | 408 | 0.97 | |
| 2 | Country | 35008 | 15976 | 15971 | 15543 | 166 | 1.07 | |
| . |
Voting Results by number of inhabitants of commune |
. |
| 1 | to 5 000 | 2755 | 1408 | 1408 | 1368 | 15 | 1.10 | |
| 2 | from 5 001 to 10 000 | 23960 | 11306 | 11294 | 11059 | 128 | 1.16 | |
| 3 | from 10 001 to 20 000 | 35192 | 17426 | 17417 | 17027 | 157 | 0.92 | |
| 4 | from 20 001 to 50 000 | 0 | 0 | 0 | 0 | 0 | 0.00 | |
| 5 | from 50 001 to 100 000 | 50962 | 28679 | 28662 | 28124 | 274 | 0.97 | |
| 6 | from 100 001 to 200 000 | 0 | 0 | 0 | 0 | 0 | 0.00 | |
| 7 | from 200 001 to 500 000 | 0 | 0 | 0 | 0 | 0 | 0.00 | |
| 8 | over 500 000 | 0 | 0 | 0 | 0 | 0 | 0.00 | |
|
|


 Legal Acts
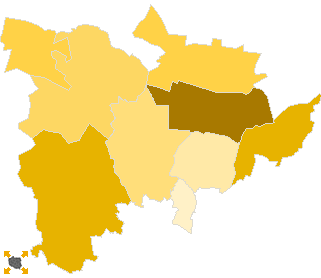
 Legal Acts