.
.
 
. .
Voting Results
.
. . Voting Results for Committee . .
. .
. . . . . . . . . . . . . . . .
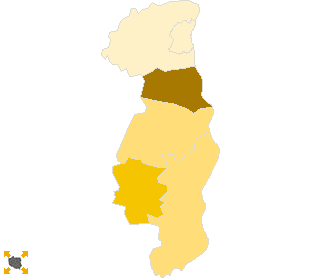
Polska / Gdańsk / tczewski, pow. ...
Komitet Wyborczy Liga Polskich Rodzin
List's Number: 3
No. of valid votes: 42820
No. of votes per List: 561
1.31%
lack1.19%1.26%1.33%1.40%1.47%1.54%1.61%1.68%1.75%1.82%not
of data1.25%1.32%1.39%1.46%1.53%1.60%1.67%1.74%1.81%1.89%applicable

See also:
. . Voting Results for Committee. . .
. .
. . . . . . . . . . . . .
No. Name No. of entitled
to vote
No. of ballot papers
issued
No. of votes No. of votes: per list / valid [%]
total valid per List
221402Gniew, gm.12416514051364958721.45
221403Morzeszczyn, gm.2817112211221054171.61
221404Pelplin, gm.12640530553045110721.41
221405Subkowy, gm.3847166616651608301.87
221406Tczew, gm.8563397239703835461.20
221401Tczew, m.471282666426659262553241.23
  tczewski, pow. 87411 43869 43856 42820 561 1.31

. . Voting Results for Candidates . .
. .
. . . . . . . . . . .
No. Surname Names No. of votes % No. of votes per candidate/No. per list % No. of votes per candidate/No. of valid votes
1KORWIN-MIKKE Janusz Ryszard25745.810.60
2SZUMSKA Gertruda Helena396.950.09
3WINKLAS Maciej Franciszek213.740.05
4MARUSIK Elżbieta Maria264.630.06
5CIECHANOWSKI Mirosław Andrzej152.670.04
6LEWANDOWSKA Rita Irena183.200.04
7MARUSIK Michał162.850.04
8JANKOWSKI Władysław81.420.02
9SYNAK Maciej Piotr162.850.04
10BŁASZKOWSKI Piotr Jan142.490.03
11SUCHECKI Rafał142.490.03
12SCHROEDER Karol Wiktor101.780.02
13GRABOWSKI Paweł Jan254.450.06
14RZESZUTEK Krzysztof Andrzej30.530.01
15BIELICKI Dawid Piotr152.670.04
16JANKOWSKI Paweł Henryk61.060.01
17ŁUKASZEWICZ Dariusz Cezary61.060.01
18PNIEWSKI Adam Roman20.350.00 
19KARBOWNICZEK Rafał Damian40.710.01
20KARCZEWSKI Adam Paweł71.240.02
21ZWOIŃSKI Adam Sławomir71.240.02
22SZYDŁOWSKA Wanda111.960.03
23DOWGIAŁŁO Krzysztof61.060.01
24PAJĄK Roman152.670.04
Σ   561 100.00 1.31
 
. . Voting Results by location of ward electoral commission. . .
. .
. . . . . . . . . . . . .
No. Name No. of entitled
to vote
No. of ballot
papers issued
No. of votes No. of votes: per list / valid [%]
total valid per List
1City605703269632687320624091.28
2Country268411117311169107581521.41
. Voting Results by number of inhabitants of commune .
1to 5 0002817112211221054171.61
2from 5 001 to 10 0003847166616651608301.87
3from 10 001 to 20 000336191441714410139031901.37
4from 20 001 to 50 000000000.00 
5from 50 001 to 100 000471282666426659262553241.23
6from 100 001 to 200 000000000.00 
7from 200 001 to 500 000000000.00 
8over 500 000000000.00 

  Legal Acts Documents Electoral Bodies Election Committees and Candidates Turnout Results Statistical Data SENATE Created by
 top