.
.
Legal Acts
Documents
Electoral Bodies
Election Committees and Candidates
Turnout
Results
Statistical Data
SENATE
Created by
.
.
Voting Results
.
.
.
Voting Results for Committee
.
.
.
.
.
.
.
.
.
.
.
.
.
.
.
.
.
.
.
.
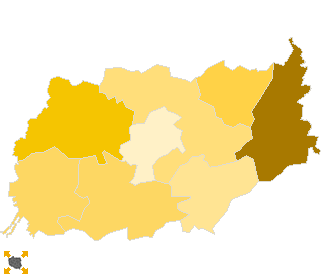
Polska
/
Gdynia
/
kartuski, pow.
...
Komitet Wyborczy Liga Polskich Rodzin
List's Number:
3
No. of valid votes:
44914
No. of votes per List:
928
2.07%
lack
0.82%
1.05%
1.28%
1.51%
1.74%
1.97%
2.20%
2.43%
2.66%
2.89%
not
of data
1.04%
1.27%
1.50%
1.73%
1.96%
2.19%
2.42%
2.65%
2.88%
3.12%
applicable
See also:
Turnout
Votes per Lists
Votes per Candidates
Information about Election Committee
Election results
Voting Results by location of ward electoral commission
.
.
Voting Results for Committee.
.
.
.
.
.
.
.
.
.
.
.
.
.
.
.
.
.
No.
Name
No. of entitled
to vote
No. of ballot papers
issued
No. of votes
No. of votes: per list / valid [%]
total
valid
per List
220501
Chmielno, gm.
4783
2716
2716
2652
22
0.83
220502
Kartuzy, gm.
23485
13809
13795
13531
224
1.66
220503
Przodkowo, gm.
5022
2740
2727
2647
53
2.00
220504
Sierakowice, gm.
11835
6904
6903
6721
149
2.22
220505
Somonino, gm.
6648
3338
3338
3212
48
1.49
220506
Stężyca, gm.
6401
3528
3527
3434
62
1.81
220507
Sulęczyno, gm.
3601
2049
2049
1955
38
1.94
220508
Żukowo, gm.
18518
11022
11015
10762
332
3.08
kartuski, pow.
80293
46106
46070
44914
928
2.07
.
.
Voting Results for Candidates
.
.
.
.
.
.
.
.
.
.
.
.
.
.
.
No.
Surname Names
No. of votes
% No. of votes per candidate/No. per list
% No. of votes per candidate/No. of valid votes
1
STRĄK Robert
202
21.76
0.45
2
PAPROCKI Krzysztof Konrad
76
8.18
0.17
3
DASE Barbara Mirosława
41
4.41
0.09
4
PIECHOTA Bogusław Józef
19
2.04
0.04
5
BARGIELSKI Krzysztof
11
1.18
0.02
6
TREDER Brygida
249
26.83
0.55
7
PAJĄK Mirosław
27
2.90
0.06
8
KLAS Marek Jerzy
19
2.04
0.04
9
MASZOTA Zbigniew Marian
7
0.75
0.02
10
MAGULSKI Tomasz Piotr
15
1.61
0.03
11
HALIŻAK Krzysztof Stanisław
7
0.75
0.02
12
WOJCIECHOWICZ Zbigniew Edmund
18
1.93
0.04
13
BUJAK Mirosław Paweł
14
1.50
0.03
14
JAŁOWIEC Krzysztof
11
1.18
0.02
15
KACPRZYCKA Halina Maria
18
1.93
0.04
16
GÓRSKI Tomasz Wojciech
24
2.58
0.05
17
TUSZYŃSKI Jan Łukasz
30
3.23
0.07
18
OŻGA Marian
8
0.86
0.02
19
PRONDZIŃSKI Grzegorz Józef
5
0.53
0.01
20
SOCHA Sebastian
14
1.50
0.03
21
CIESIELSKA Ewa Izabela
11
1.18
0.02
22
WĘSIERSKI Zbigniew Jan
14
1.50
0.03
23
WARZECHA Konrad Jacek
3
0.32
0.01
24
KWIECIEŃ Józefina
33
3.55
0.07
25
SAKOWICZ Michał Dariusz
13
1.40
0.03
26
LISOWSKA Wioleta
13
1.40
0.03
27
GRABARCZYK Lesław Bronisław
5
0.53
0.01
28
PIETRZAK Teresa Janina
21
2.26
0.05
Σ
928
100.00
2.06
.
.
Voting Results by location of ward electoral commission.
.
.
.
.
.
.
.
.
.
.
.
.
.
.
.
.
.
No.
Name
No. of entitled
to vote
No. of ballot
papers issued
No. of votes
No. of votes: per list / valid [%]
total
valid
per List
1
City
17536
10988
10974
10811
252
2.33
2
Country
62757
35118
35096
34103
676
1.98
.
Voting Results by number of inhabitants of commune
.
1
to 5 000
3601
2049
2049
1955
38
1.94
2
from 5 001 to 10 000
22854
12322
12308
11945
185
1.55
3
from 10 001 to 20 000
11835
6904
6903
6721
149
2.22
4
from 20 001 to 50 000
42003
24831
24810
24293
556
2.29
5
from 50 001 to 100 000
0
0
0
0
0
0.00
6
from 100 001 to 200 000
0
0
0
0
0
0.00
7
from 200 001 to 500 000
0
0
0
0
0
0.00
8
over 500 000
0
0
0
0
0
0.00
Legal Acts
Documents
Electoral Bodies
Election Committees and Candidates
Turnout
Results
Statistical Data
SENATE
Created by
Copyright © 2007
Mikrobit Sp. z o.o.
. All Rights Reserved.
top