.
.
Legal Acts
Documents
Electoral Bodies
Election Committees and Candidates
Turnout
Results
Statistical Data
SENATE
Created by
.
.
Voting Results
.
.
.
Voting Results for Committee
.
.
.
.
.
.
.
.
.
.
.
.
.
.
.
.
.
.
.
.
Polska
/
Gdynia
/
człuchowski, pow.
...
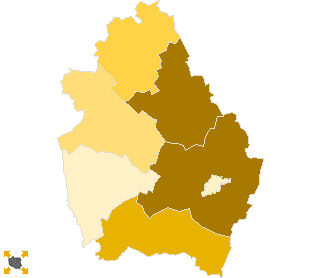
Komitet Wyborczy Liga Polskich Rodzin
List's Number:
3
No. of valid votes:
21002
No. of votes per List:
273
1.30%
lack
0.92%
1.02%
1.12%
1.22%
1.32%
1.42%
1.52%
1.62%
1.72%
1.82%
not
of data
1.01%
1.11%
1.21%
1.31%
1.41%
1.51%
1.61%
1.71%
1.81%
1.92%
applicable
See also:
Turnout
Votes per Lists
Votes per Candidates
Information about Election Committee
Election results
Voting Results by location of ward electoral commission
.
.
Voting Results for Committee.
.
.
.
.
.
.
.
.
.
.
.
.
.
.
.
.
.
No.
Name
No. of entitled
to vote
No. of ballot papers
issued
No. of votes
No. of votes: per list / valid [%]
total
valid
per List
220302
Czarne, gm.
8841
4476
4476
4292
40
0.93
220303
Człuchów, gm.
7595
3072
3070
2962
54
1.82
220301
Człuchów, m.
11932
6592
6592
6392
59
0.92
220304
Debrzno, gm.
7177
2964
2964
2837
48
1.69
220305
Koczała, gm.
2860
1322
1322
1242
18
1.45
220306
Przechlewo, gm.
4791
2280
2279
2183
40
1.83
220307
Rzeczenica, gm.
2937
1153
1153
1094
14
1.28
człuchowski, pow.
46133
21859
21856
21002
273
1.30
.
.
Voting Results for Candidates
.
.
.
.
.
.
.
.
.
.
.
.
.
.
.
No.
Surname Names
No. of votes
% No. of votes per candidate/No. per list
% No. of votes per candidate/No. of valid votes
1
STRĄK Robert
57
20.87
0.27
2
PAPROCKI Krzysztof Konrad
18
6.59
0.09
3
DASE Barbara Mirosława
10
3.66
0.05
4
PIECHOTA Bogusław Józef
7
2.56
0.03
5
BARGIELSKI Krzysztof
3
1.09
0.01
6
TREDER Brygida
7
2.56
0.03
7
PAJĄK Mirosław
14
5.12
0.07
8
KLAS Marek Jerzy
10
3.66
0.05
9
MASZOTA Zbigniew Marian
3
1.09
0.01
10
MAGULSKI Tomasz Piotr
12
4.39
0.06
11
HALIŻAK Krzysztof Stanisław
6
2.19
0.03
12
WOJCIECHOWICZ Zbigniew Edmund
4
1.46
0.02
13
BUJAK Mirosław Paweł
17
6.22
0.08
14
JAŁOWIEC Krzysztof
14
5.12
0.07
15
KACPRZYCKA Halina Maria
12
4.39
0.06
16
GÓRSKI Tomasz Wojciech
6
2.19
0.03
17
TUSZYŃSKI Jan Łukasz
8
2.93
0.04
18
OŻGA Marian
4
1.46
0.02
19
PRONDZIŃSKI Grzegorz Józef
6
2.19
0.03
20
SOCHA Sebastian
10
3.66
0.05
21
CIESIELSKA Ewa Izabela
1
0.36
0.00
22
WĘSIERSKI Zbigniew Jan
5
1.83
0.02
23
WARZECHA Konrad Jacek
0
0.00
0.00
24
KWIECIEŃ Józefina
5
1.83
0.02
25
SAKOWICZ Michał Dariusz
8
2.93
0.04
26
LISOWSKA Wioleta
15
5.49
0.07
27
GRABARCZYK Lesław Bronisław
4
1.46
0.02
28
PIETRZAK Teresa Janina
7
2.56
0.03
Σ
273
100.00
1.29
.
.
Voting Results by location of ward electoral commission.
.
.
.
.
.
.
.
.
.
.
.
.
.
.
.
.
.
No.
Name
No. of entitled
to vote
No. of ballot
papers issued
No. of votes
No. of votes: per list / valid [%]
total
valid
per List
1
City
22205
11989
11989
11609
115
0.99
2
Country
23928
9870
9867
9393
158
1.68
.
Voting Results by number of inhabitants of commune
.
1
to 5 000
5797
2475
2475
2336
32
1.37
2
from 5 001 to 10 000
20809
9720
9719
9312
128
1.37
3
from 10 001 to 20 000
19527
9664
9662
9354
113
1.21
4
from 20 001 to 50 000
0
0
0
0
0
0.00
5
from 50 001 to 100 000
0
0
0
0
0
0.00
6
from 100 001 to 200 000
0
0
0
0
0
0.00
7
from 200 001 to 500 000
0
0
0
0
0
0.00
8
over 500 000
0
0
0
0
0
0.00
Legal Acts
Documents
Electoral Bodies
Election Committees and Candidates
Turnout
Results
Statistical Data
SENATE
Created by
Copyright © 2007
Mikrobit Sp. z o.o.
. All Rights Reserved.
top