.
.
Legal Acts
Documents
Electoral Bodies
Election Committees and Candidates
Turnout
Results
Statistical Data
SENATE
Created by
.
.
Voting Results
.
.
.
Voting Results for Committee
.
.
.
.
.
.
.
.
.
.
.
.
.
.
.
.
.
.
.
.
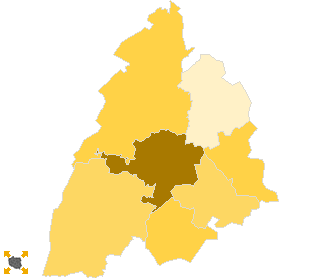
Polska
/
Białystok
/
moniecki, pow.
...
Komitet Wyborczy Liga Polskich Rodzin
List's Number:
3
No. of valid votes:
13369
No. of votes per List:
278
2.08%
lack
0.92%
1.10%
1.28%
1.46%
1.64%
1.82%
2.00%
2.18%
2.36%
2.54%
not
of data
1.09%
1.27%
1.45%
1.63%
1.81%
1.99%
2.17%
2.35%
2.53%
2.72%
applicable
See also:
Turnout
Votes per Lists
Votes per Candidates
Information about Election Committee
Election results
Voting Results by location of ward electoral commission
.
.
Voting Results for Committee.
.
.
.
.
.
.
.
.
.
.
.
.
.
.
.
.
.
No.
Name
No. of entitled
to vote
No. of ballot papers
issued
No. of votes
No. of votes: per list / valid [%]
total
valid
per List
200801
Goniądz, gm.
4130
1685
1683
1628
32
1.97
200802
Jasionówka, gm.
2455
999
999
976
19
1.95
200803
Jaświły, gm.
4458
1677
1677
1626
15
0.92
200804
Knyszyn, gm.
3945
1633
1633
1556
28
1.80
200805
Krypno, gm.
3231
1309
1309
1282
25
1.95
200806
Mońki, gm.
12656
5209
5208
5057
137
2.71
200807
Trzcianne, gm.
3821
1305
1305
1244
22
1.77
moniecki, pow.
34696
13817
13814
13369
278
2.08
.
.
Voting Results for Candidates
.
.
.
.
.
.
.
.
.
.
.
.
.
.
.
No.
Surname Names
No. of votes
% No. of votes per candidate/No. per list
% No. of votes per candidate/No. of valid votes
1
FEDOROWICZ Andrzej
80
28.77
0.60
2
KUŹMIEROWSKA Paulina
6
2.15
0.04
3
JAROTA Jan
3
1.07
0.02
4
JABŁOŃSKA Elżbieta
8
2.87
0.06
5
PUKSZA Zbigniew
2
0.71
0.01
6
DEC Katarzyna
13
4.67
0.10
7
LASKOWSKI Józef
3
1.07
0.02
8
BARTNIK Stanisław
5
1.79
0.04
9
JĘDRZEJEWSKI Andrzej Tomasz
3
1.07
0.02
10
BACZEWSKI Janusz
7
2.51
0.05
11
ŁUCZYCKI Edward Stanisław
2
0.71
0.01
12
CHILIŃSKI Tomasz
7
2.51
0.05
13
PERKOWSKI Tadeusz
1
0.35
0.01
14
GUTKOWSKA Magdalena
6
2.15
0.04
15
ŚWIDERSKI Ryszard Bohdan
4
1.43
0.03
16
PAWŁOWSKI Hubert
4
1.43
0.03
17
KUŹMIŃSKI Stanisław
1
0.35
0.01
18
TOMCZYK Maciej
1
0.35
0.01
19
JEMIELITA Stanisław
3
1.07
0.02
20
STANKIEWICZ Zenon Wojciech
3
1.07
0.02
21
MILEWSKI Stanisław
5
1.79
0.04
22
SNARSKI Antoni
4
1.43
0.03
23
NONIEWICZ Piotr
2
0.71
0.01
24
MILLER Bartosz Karol
6
2.15
0.04
25
JARNICKI Józef
0
0.00
0.00
26
KOCHANOWSKI Andrzej
7
2.51
0.05
27
JAMIOŁKOWSKA-KĘPCZYŃSKA Alicja Maria
3
1.07
0.02
28
ROGOWSKI Zbigniew
0
0.00
0.00
29
PTASZKOWSKI Andrzej
0
0.00
0.00
30
WASILEWSKI Marek
89
32.01
0.67
Σ
278
100.00
2.07
.
.
Voting Results by location of ward electoral commission.
.
.
.
.
.
.
.
.
.
.
.
.
.
.
.
.
.
No.
Name
No. of entitled
to vote
No. of ballot
papers issued
No. of votes
No. of votes: per list / valid [%]
total
valid
per List
1
City
15827
6754
6751
6531
163
2.50
2
Country
18869
7063
7063
6838
115
1.68
.
Voting Results by number of inhabitants of commune
.
1
to 5 000
9507
3613
3613
3502
66
1.88
2
from 5 001 to 10 000
12533
4995
4993
4810
75
1.56
3
from 10 001 to 20 000
12656
5209
5208
5057
137
2.71
4
from 20 001 to 50 000
0
0
0
0
0
0.00
5
from 50 001 to 100 000
0
0
0
0
0
0.00
6
from 100 001 to 200 000
0
0
0
0
0
0.00
7
from 200 001 to 500 000
0
0
0
0
0
0.00
8
over 500 000
0
0
0
0
0
0.00
Legal Acts
Documents
Electoral Bodies
Election Committees and Candidates
Turnout
Results
Statistical Data
SENATE
Created by
Copyright © 2007
Mikrobit Sp. z o.o.
. All Rights Reserved.
top