.
.
Legal Acts
Documents
Electoral Bodies
Election Committees and Candidates
Turnout
Results
Statistical Data
SENATE
Created by
.
.
Voting Results
.
.
.
Voting Results for Committee
.
.
.
.
.
.
.
.
.
.
.
.
.
.
.
.
.
.
.
.
Polska
/
Białystok
/
bielski, pow.
...
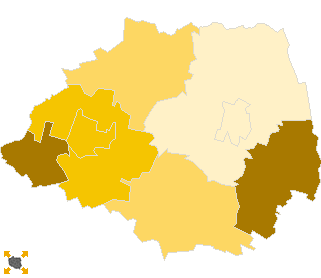
Komitet Wyborczy Liga Polskich Rodzin
List's Number:
3
No. of valid votes:
23639
No. of votes per List:
284
1.20%
lack
0.76%
0.90%
1.04%
1.18%
1.32%
1.46%
1.60%
1.74%
1.88%
2.02%
not
of data
0.89%
1.03%
1.17%
1.31%
1.45%
1.59%
1.73%
1.87%
2.01%
2.16%
applicable
See also:
Turnout
Votes per Lists
Votes per Candidates
Information about Election Committee
Election results
Voting Results by location of ward electoral commission
.
.
Voting Results for Committee.
.
.
.
.
.
.
.
.
.
.
.
.
.
.
.
.
.
No.
Name
No. of entitled
to vote
No. of ballot papers
issued
No. of votes
No. of votes: per list / valid [%]
total
valid
per List
200303
Bielsk Podlaski, gm.
6367
2385
2384
2339
18
0.77
200301
Bielsk Podlaski, m.
21812
11322
11312
11127
98
0.88
200304
Boćki, gm.
4065
1711
1711
1658
22
1.33
200305
Brańsk, gm.
5131
2862
2860
2807
48
1.71
200302
Brańsk, m.
3113
1763
1763
1700
28
1.65
200306
Orla, gm.
2932
1160
1160
1114
23
2.06
200307
Rudka, gm.
1679
911
910
888
18
2.03
200308
Wyszki, gm.
4002
2042
2039
2006
29
1.45
bielski, pow.
49101
24156
24139
23639
284
1.20
.
.
Voting Results for Candidates
.
.
.
.
.
.
.
.
.
.
.
.
.
.
.
No.
Surname Names
No. of votes
% No. of votes per candidate/No. per list
% No. of votes per candidate/No. of valid votes
1
FEDOROWICZ Andrzej
87
30.63
0.37
2
KUŹMIEROWSKA Paulina
23
8.09
0.10
3
JAROTA Jan
18
6.33
0.08
4
JABŁOŃSKA Elżbieta
20
7.04
0.08
5
PUKSZA Zbigniew
3
1.05
0.01
6
DEC Katarzyna
9
3.16
0.04
7
LASKOWSKI Józef
9
3.16
0.04
8
BARTNIK Stanisław
3
1.05
0.01
9
JĘDRZEJEWSKI Andrzej Tomasz
6
2.11
0.03
10
BACZEWSKI Janusz
4
1.40
0.02
11
ŁUCZYCKI Edward Stanisław
2
0.70
0.01
12
CHILIŃSKI Tomasz
1
0.35
0.00
13
PERKOWSKI Tadeusz
7
2.46
0.03
14
GUTKOWSKA Magdalena
7
2.46
0.03
15
ŚWIDERSKI Ryszard Bohdan
4
1.40
0.02
16
PAWŁOWSKI Hubert
3
1.05
0.01
17
KUŹMIŃSKI Stanisław
4
1.40
0.02
18
TOMCZYK Maciej
4
1.40
0.02
19
JEMIELITA Stanisław
3
1.05
0.01
20
STANKIEWICZ Zenon Wojciech
6
2.11
0.03
21
MILEWSKI Stanisław
1
0.35
0.00
22
SNARSKI Antoni
44
15.49
0.19
23
NONIEWICZ Piotr
3
1.05
0.01
24
MILLER Bartosz Karol
3
1.05
0.01
25
JARNICKI Józef
0
0.00
0.00
26
KOCHANOWSKI Andrzej
2
0.70
0.01
27
JAMIOŁKOWSKA-KĘPCZYŃSKA Alicja Maria
0
0.00
0.00
28
ROGOWSKI Zbigniew
0
0.00
0.00
29
PTASZKOWSKI Andrzej
1
0.35
0.00
30
WASILEWSKI Marek
7
2.46
0.03
Σ
284
100.00
1.20
.
.
Voting Results by location of ward electoral commission.
.
.
.
.
.
.
.
.
.
.
.
.
.
.
.
.
.
No.
Name
No. of entitled
to vote
No. of ballot
papers issued
No. of votes
No. of votes: per list / valid [%]
total
valid
per List
1
City
24925
13085
13075
12827
126
0.98
2
Country
24176
11071
11064
10812
158
1.46
.
Voting Results by number of inhabitants of commune
.
1
to 5 000
7724
3834
3833
3702
69
1.86
2
from 5 001 to 10 000
19565
9000
8994
8810
117
1.33
3
from 10 001 to 20 000
0
0
0
0
0
0.00
4
from 20 001 to 50 000
21812
11322
11312
11127
98
0.88
5
from 50 001 to 100 000
0
0
0
0
0
0.00
6
from 100 001 to 200 000
0
0
0
0
0
0.00
7
from 200 001 to 500 000
0
0
0
0
0
0.00
8
over 500 000
0
0
0
0
0
0.00
Legal Acts
Documents
Electoral Bodies
Election Committees and Candidates
Turnout
Results
Statistical Data
SENATE
Created by
Copyright © 2007
Mikrobit Sp. z o.o.
. All Rights Reserved.
top