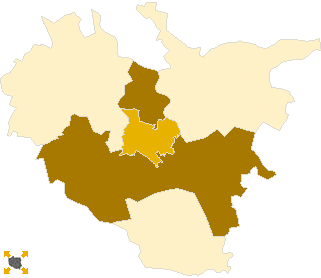
.
.
Legal Acts
Documents
Electoral Bodies
Election Committees and Candidates
Turnout
Results
Statistical Data
SENATE
Created by
.
.
Voting Results
.
.
.
Voting Results for Committee
.
.
.
.
.
.
.
.
.
.
.
.
.
.
.
.
.
.
.
.
Polska
/
Rzeszów
/
leżajski, pow.
...
Komitet Wyborczy Liga Polskich Rodzin
List's Number:
3
No. of valid votes:
26400
No. of votes per List:
428
1.62%
lack
1.31%
1.38%
1.45%
1.52%
1.59%
1.66%
1.73%
1.80%
1.87%
1.94%
not
of data
1.37%
1.44%
1.51%
1.58%
1.65%
1.72%
1.79%
1.86%
1.93%
2.01%
applicable
See also:
Turnout
Votes per Lists
Votes per Candidates
Information about Election Committee
Election results
Voting Results by location of ward electoral commission
.
.
Voting Results for Committee.
.
.
.
.
.
.
.
.
.
.
.
.
.
.
.
.
.
No.
Name
No. of entitled
to vote
No. of ballot papers
issued
No. of votes
No. of votes: per list / valid [%]
total
valid
per List
180802
Grodzisko Dolne, gm.
6391
3191
3191
3114
41
1.32
180803
Kuryłówka, gm.
4416
2120
2115
2057
28
1.36
180804
Leżajsk, gm.
14879
6838
6836
6672
131
1.96
180801
Leżajsk, m.
11921
6366
6362
6269
117
1.87
180805
Nowa Sarzyna, gm.
16638
8448
8447
8288
111
1.34
leżajski, pow.
54245
26963
26951
26400
428
1.62
.
.
Voting Results for Candidates
.
.
.
.
.
.
.
.
.
.
.
.
.
.
.
No.
Surname Names
No. of votes
% No. of votes per candidate/No. per list
% No. of votes per candidate/No. of valid votes
1
KŁECZEK Dariusz Antoni
88
20.56
0.33
2
MURIAS Halina Maria
120
28.03
0.45
3
MAZUR Krzysztof
36
8.41
0.14
4
ROMANIUK Bogdan Piotr
10
2.33
0.04
5
SZYPUŁA Andrzej
1
0.23
0.00
6
ZIĘBA Tadeusz Mikołaj
11
2.57
0.04
7
TOFILSKI Bogusław
27
6.30
0.10
8
CIEPLIŃSKI Piotr
5
1.16
0.02
9
SKOWRON Andrzej Jan
2
0.46
0.01
10
WĄSIK Stanisław
7
1.63
0.03
11
WRÓBEL Halina Grażyna
17
3.97
0.06
12
CZUBAT Krzysztof
5
1.16
0.02
13
SZAFRAŃSKI Paweł
12
2.80
0.05
14
KOZEK Marian
1
0.23
0.00
15
BARSZCZ Renata
11
2.57
0.04
16
SZOSTEK Alfred
6
1.40
0.02
17
CHMURA Józef Czesław
15
3.50
0.06
18
KOLASIŃSKI Krzysztof
4
0.93
0.02
19
SZWANDROK Dariusz Adam
2
0.46
0.01
20
GIEROŃ Mirosław Zygmunt
4
0.93
0.02
21
DZIUSZYŃSKI Lech Grzegorz
1
0.23
0.00
22
KIDA Grzegorz Aleksander
18
4.20
0.07
23
SIKORA Emil
2
0.46
0.01
24
OSTROWSKA Ewelina Monika
7
1.63
0.03
25
MAŃKO Zbigniew
4
0.93
0.02
26
SERAFIN Piotr Jacek
4
0.93
0.02
27
KURZYNA Ramona
0
0.00
0.00
28
KRZANOWSKI Bogusław
8
1.86
0.03
Σ
428
100.00
1.62
.
.
Voting Results by location of ward electoral commission.
.
.
.
.
.
.
.
.
.
.
.
.
.
.
.
.
.
No.
Name
No. of entitled
to vote
No. of ballot
papers issued
No. of votes
No. of votes: per list / valid [%]
total
valid
per List
1
City
17164
9000
8996
8829
144
1.63
2
Country
37081
17963
17955
17571
284
1.62
.
Voting Results by number of inhabitants of commune
.
1
to 5 000
0
0
0
0
0
0.00
2
from 5 001 to 10 000
10807
5311
5306
5171
69
1.33
3
from 10 001 to 20 000
26800
13204
13198
12941
248
1.92
4
from 20 001 to 50 000
16638
8448
8447
8288
111
1.34
5
from 50 001 to 100 000
0
0
0
0
0
0.00
6
from 100 001 to 200 000
0
0
0
0
0
0.00
7
from 200 001 to 500 000
0
0
0
0
0
0.00
8
over 500 000
0
0
0
0
0
0.00
Legal Acts
Documents
Electoral Bodies
Election Committees and Candidates
Turnout
Results
Statistical Data
SENATE
Created by
Copyright © 2007
Mikrobit Sp. z o.o.
. All Rights Reserved.
top